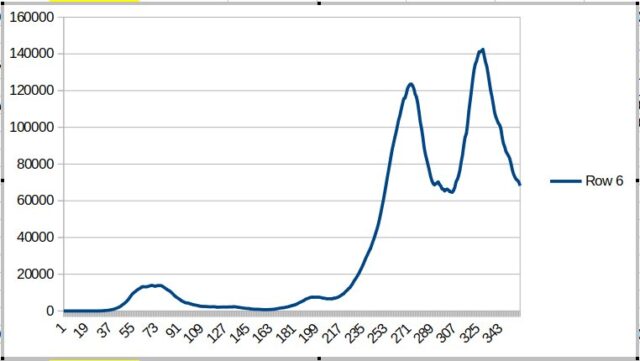
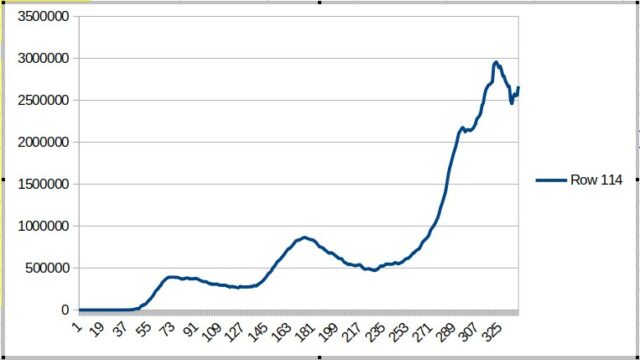
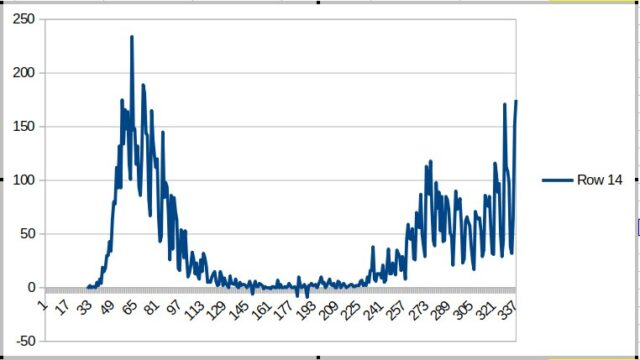
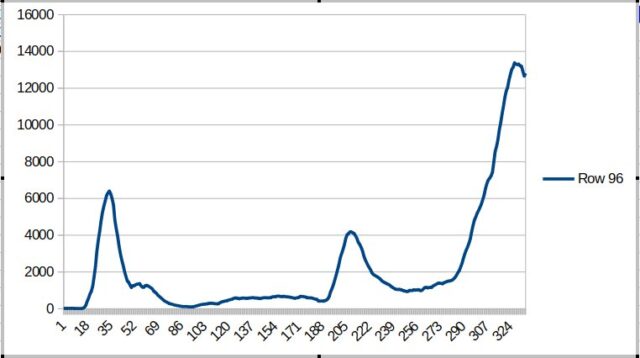
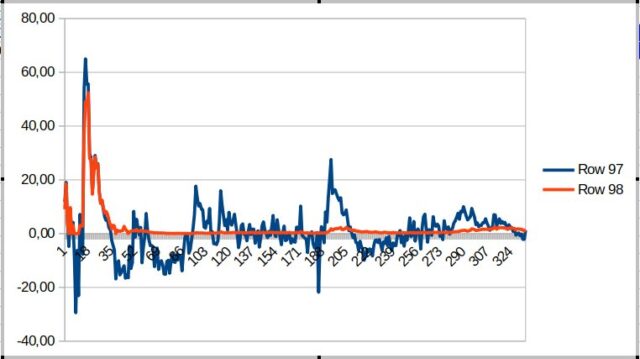
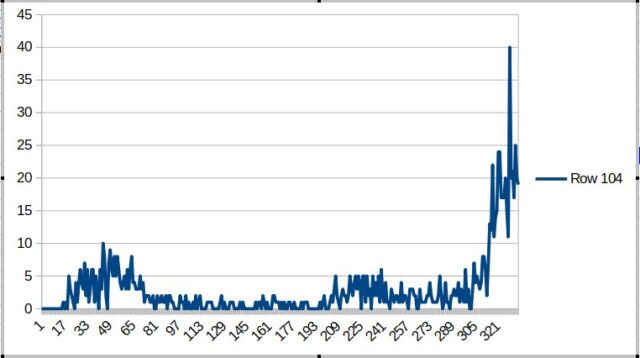
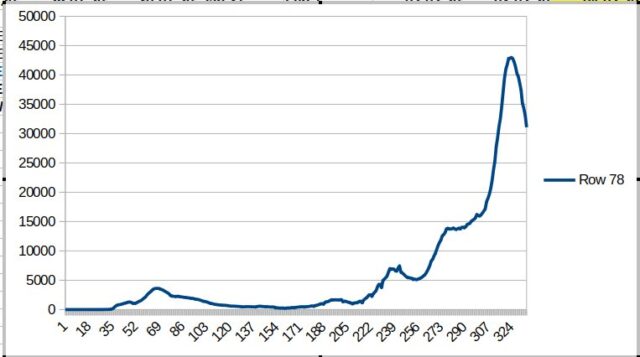
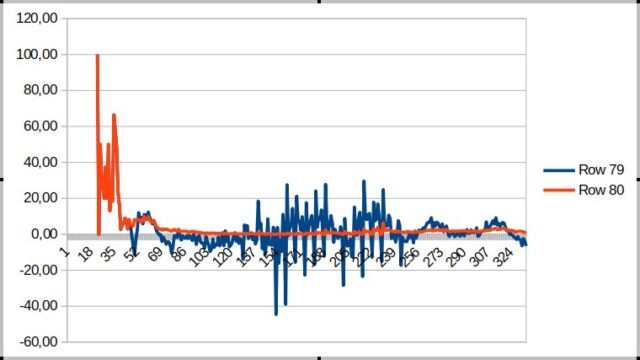
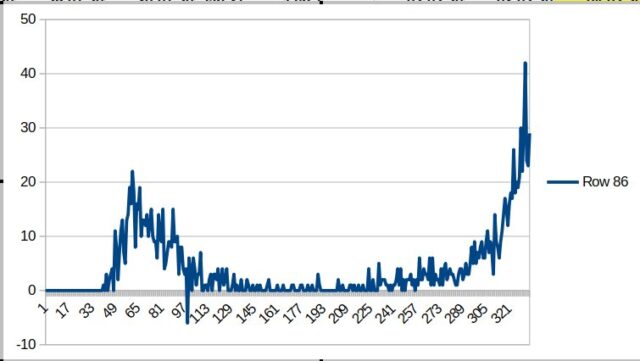
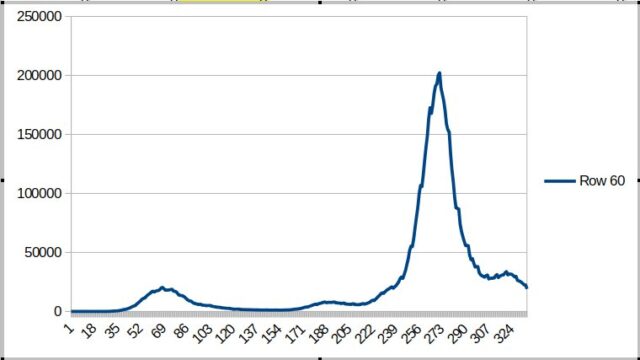
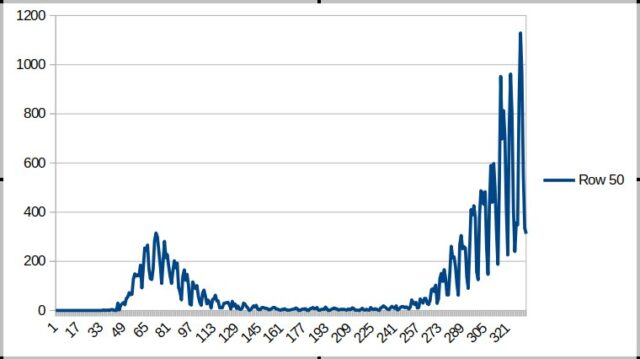
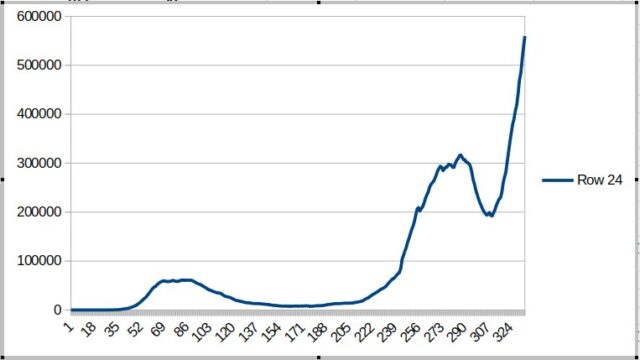
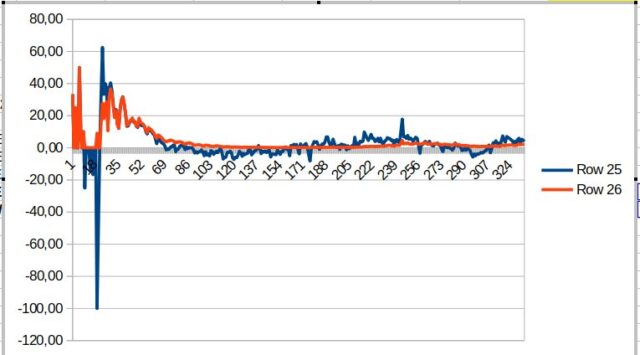
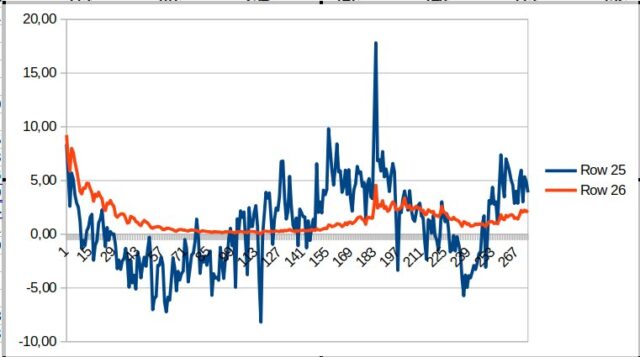
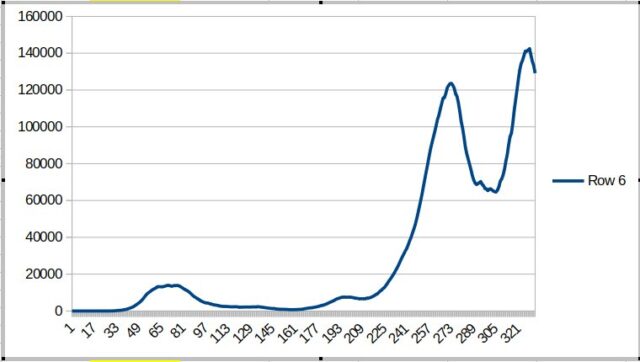
Charts are all for Netherlands, from 5 Feb until 28 Jan 2021
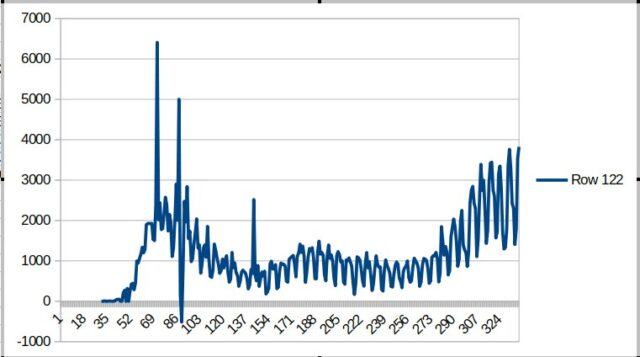
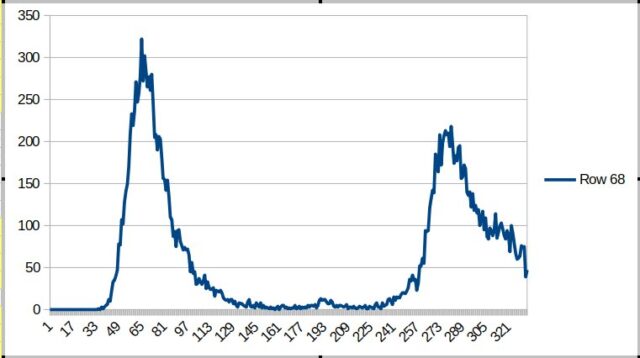
Number of people (still) sick on a given day
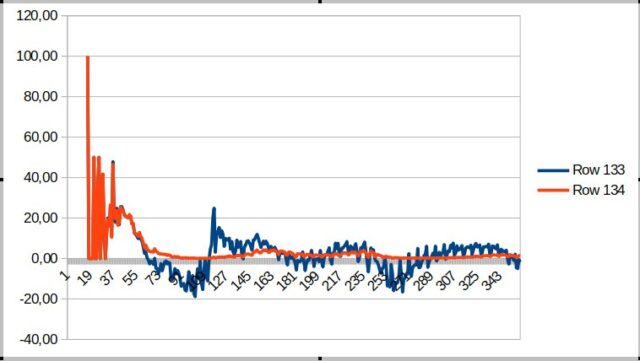
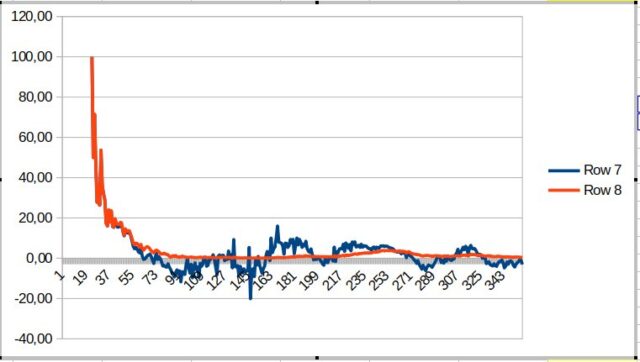
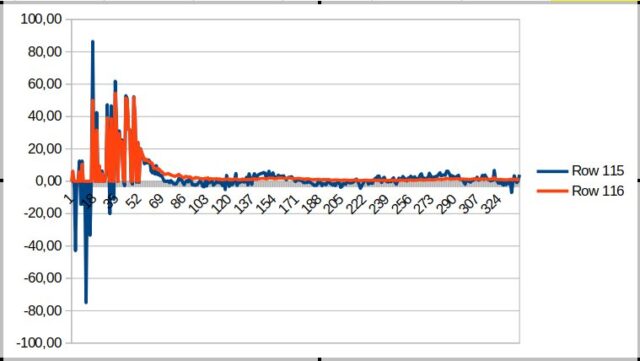
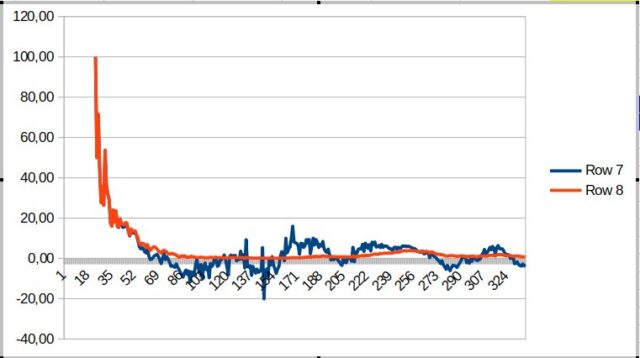
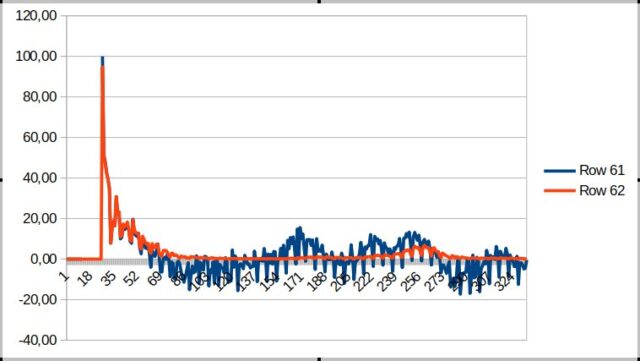
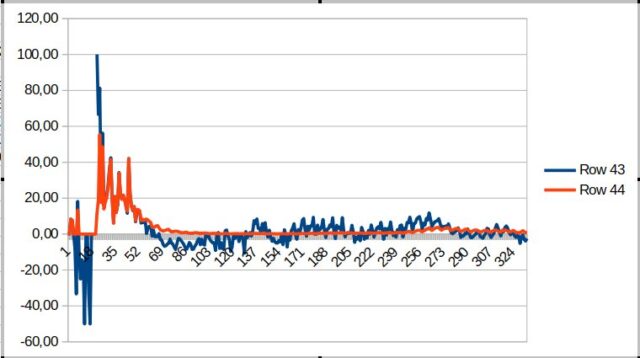
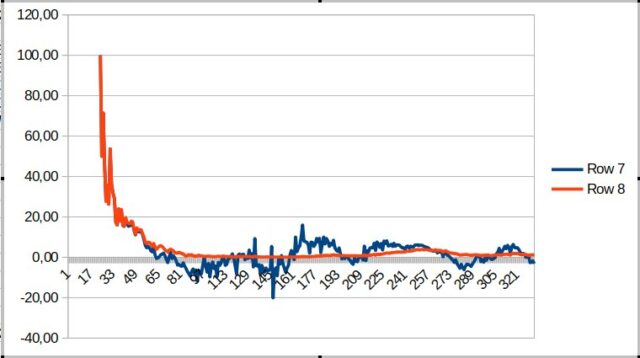
Reproduction number in % minus 1 on any given day (blue line).
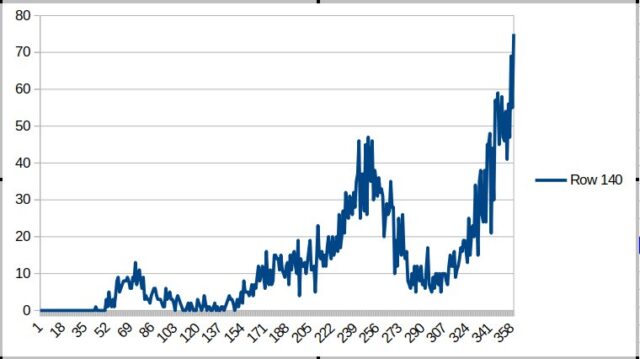
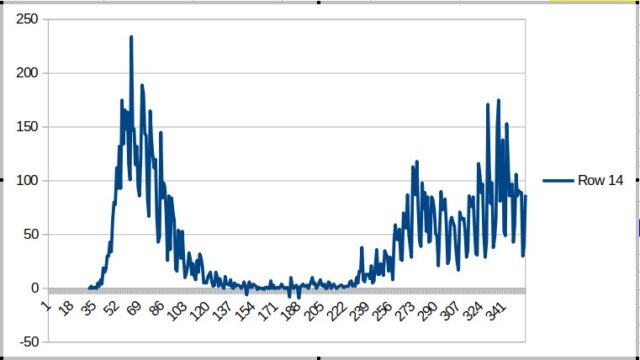
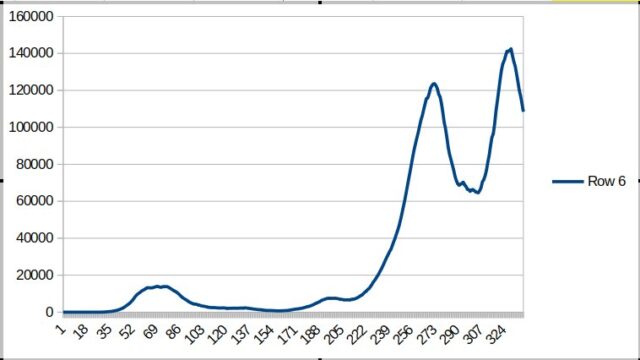
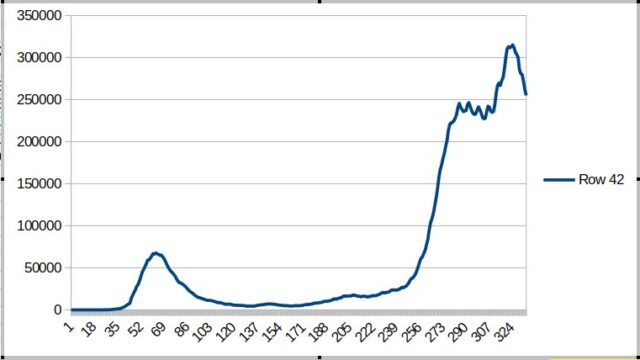
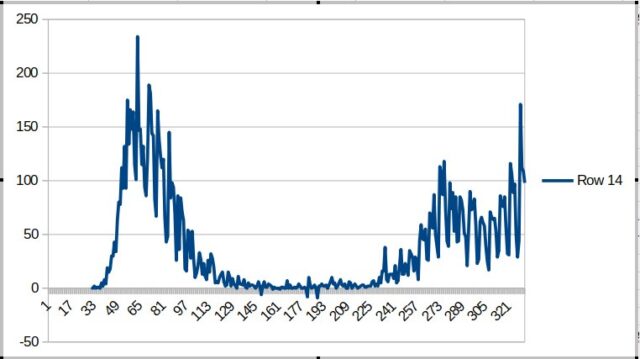
Number of deaths on a given day.
Own statistics based upon numbers supplied by WHO