Charts below are for Netherlands, from 5 Feb 2020 until 26 Nov. 2021 (today, information was only available until 26 Nov.)
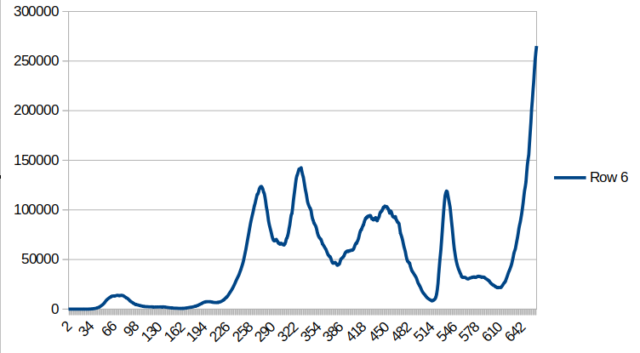
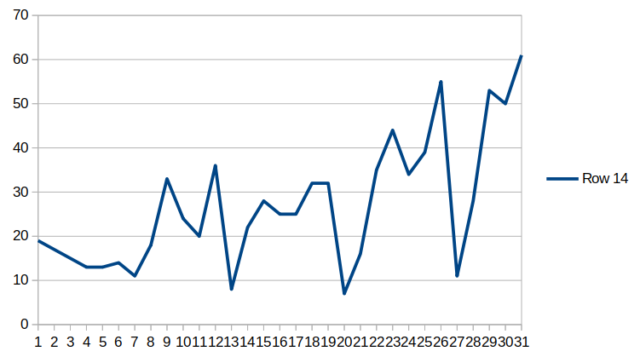
Above chart: Number of people (still) sick on a given day
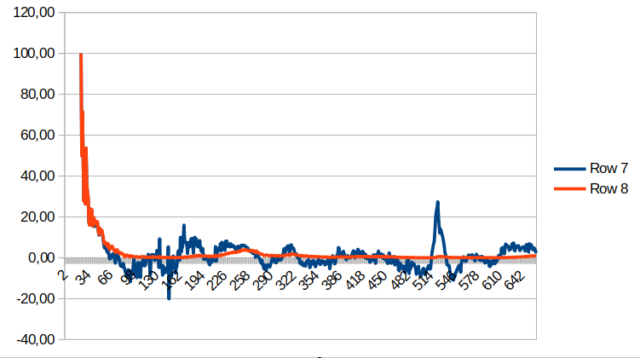
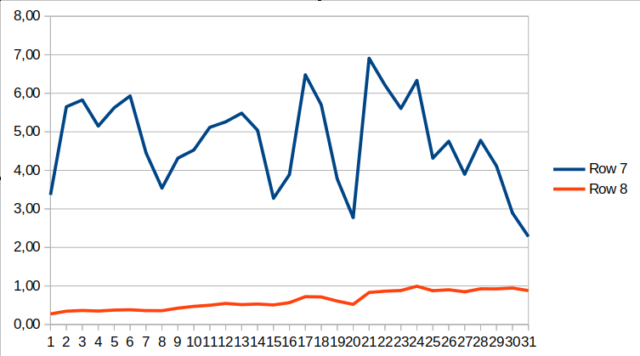
Above chart: Reproduction number in % minus 1 on any given day (blue line).
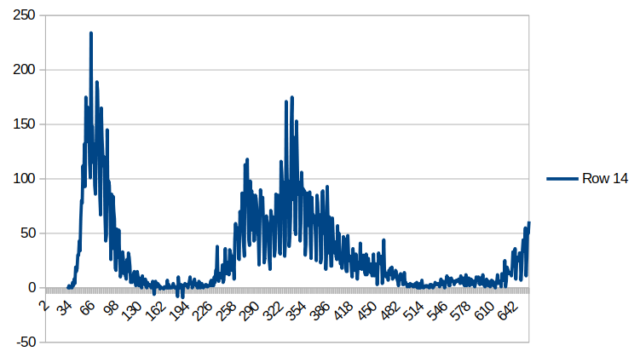
Above chart: Number of deaths on a given day.
Charts below are for Netherlands, from 27 Oct. 2020 until 26 Nov. 2021
(This much smaller time span is done to zoom in wether recent measures are already having an effect.)
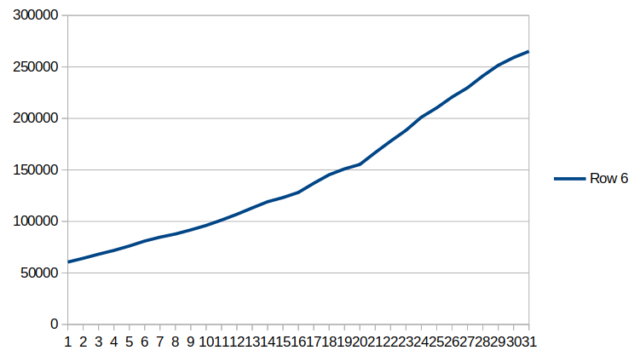
Above chart: Number of people (still) sick on a given day (last month)
Above chart: Reproduction number in % minus 1 on any given day (blue line). (last month)
Above chart: Number of deaths on a given day. (last month)
Own statistics based upon numbers supplied by WHO