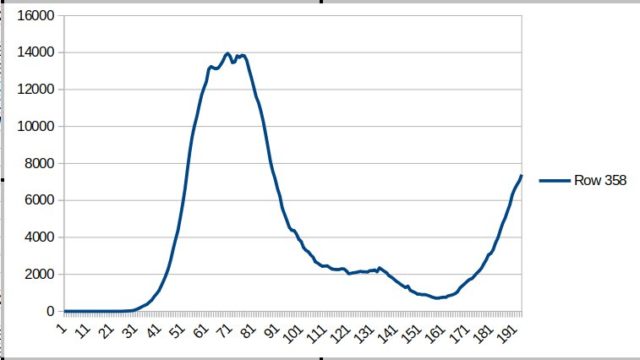
My first charts in almost two weeks. As of 16 August, both WHO and Dutch RIVM switched to weekly reports instead of daily updates. So this chart is updated until 16 August. I will keep making these charts the same way, to be able to compare old data with new, by using interpollation.
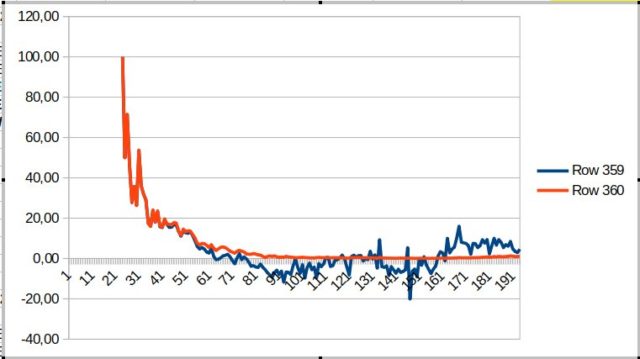
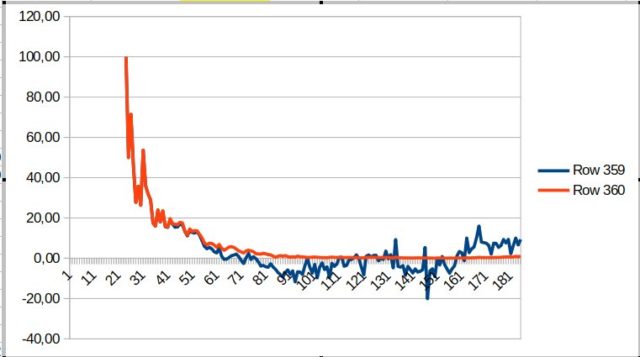
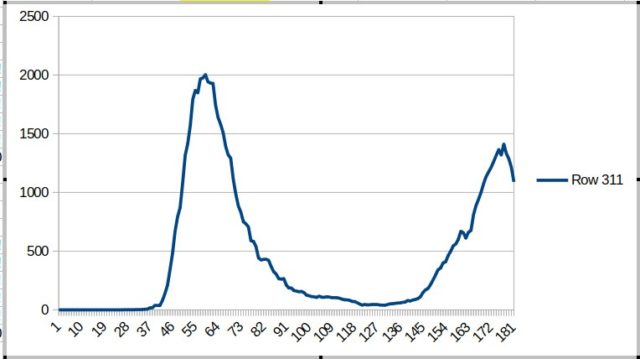
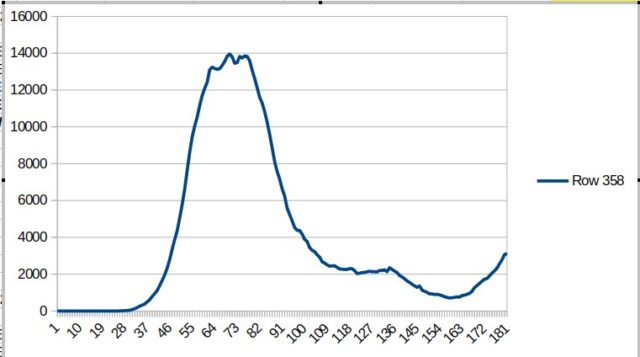
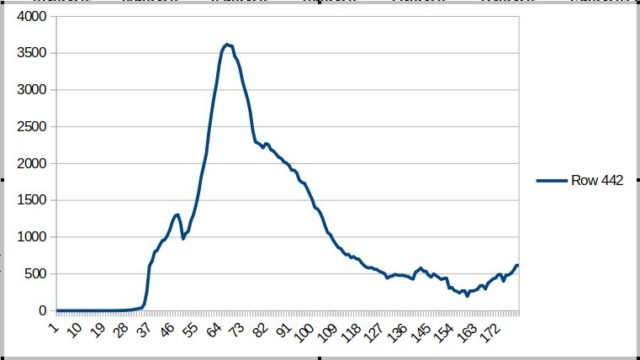
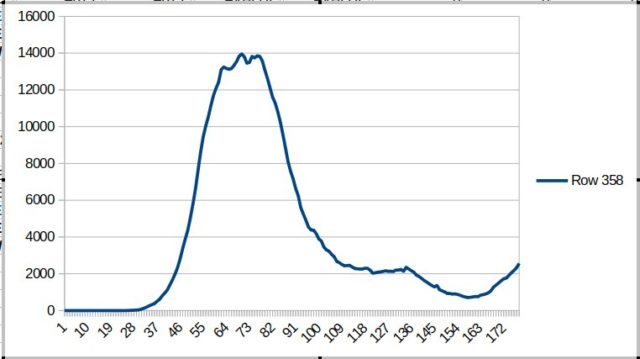
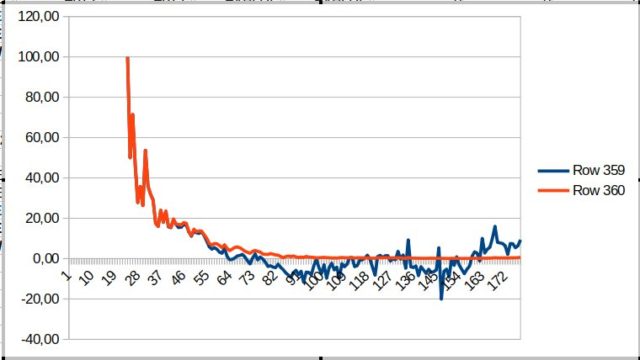
The first shows estimate of people tested positive and curretnly (still) ill and/or positive. The second shows an interpratation of the reproduction number, however, the zero line means “no change”while a positive number stands for an increase and a negative number for a decrease.
Charts are from 5 Feb until 16 Aug 2020