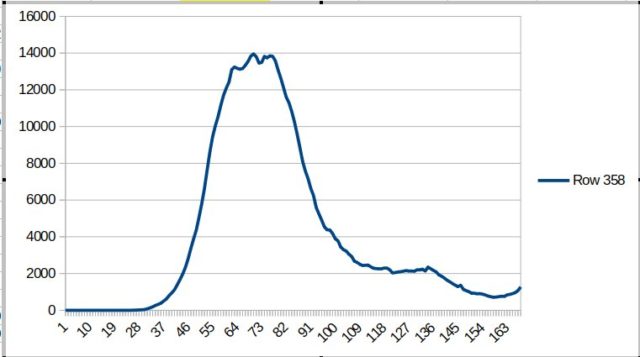
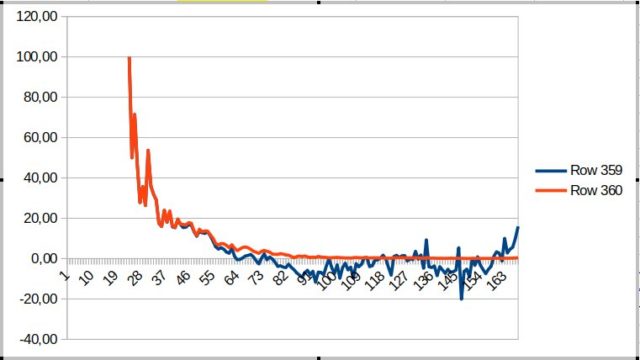
In chart one, which shows people tested positive and (still) ill in the Netherlands, you can see a small rise. The blue line in chart 2 houwver shows a representation of the reproduction number R, whoch shows a significant and fast rise.
Charts are from 5 Feb until 21 July 2020