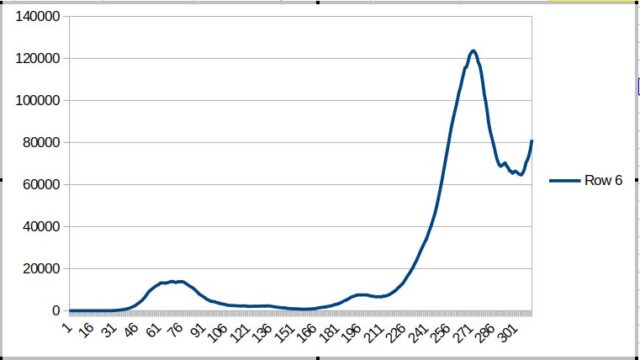
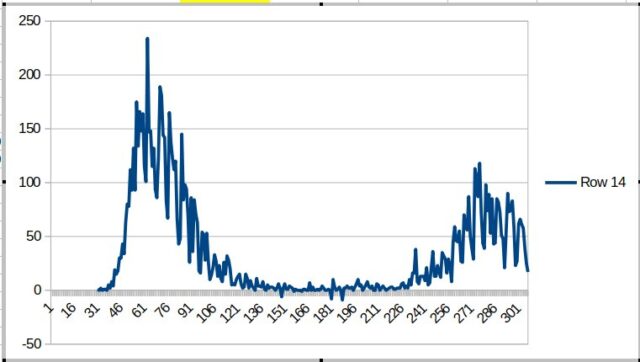
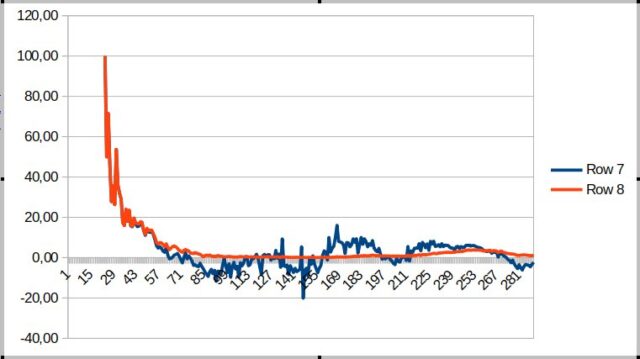
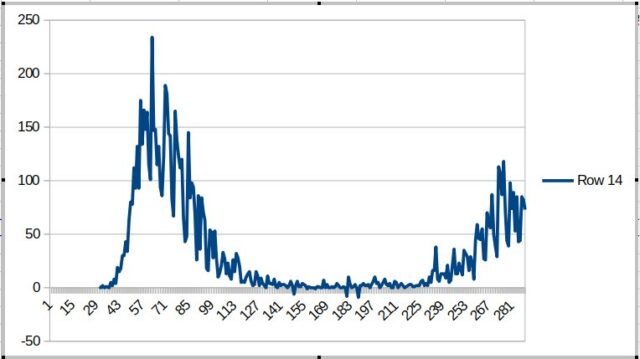
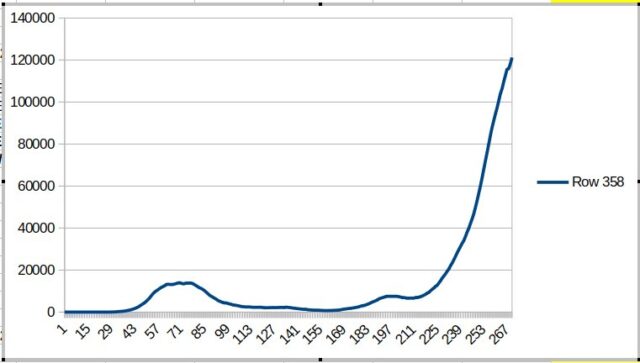
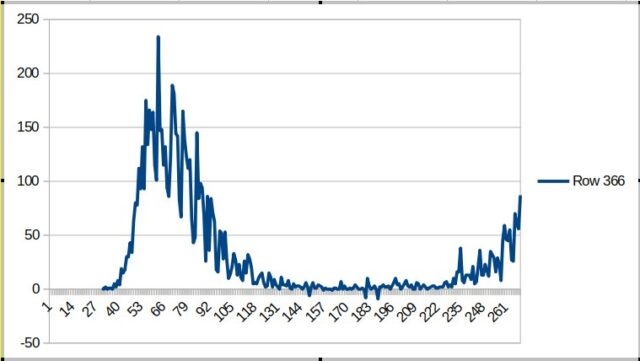
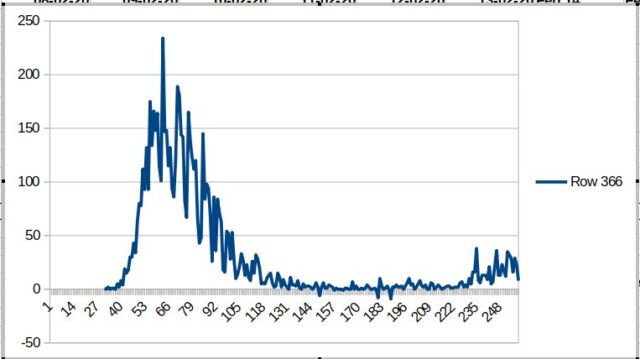
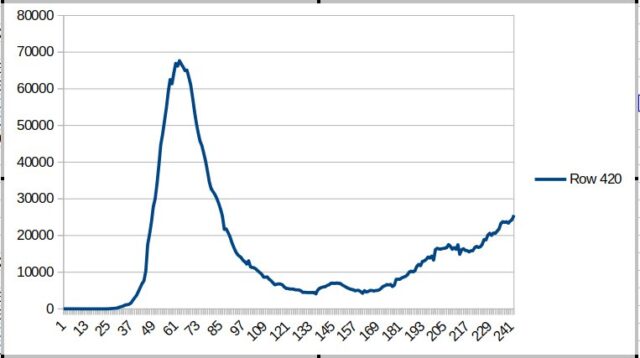
Charts are all for Belgium, from 5 Feb until 3 Jan 2021
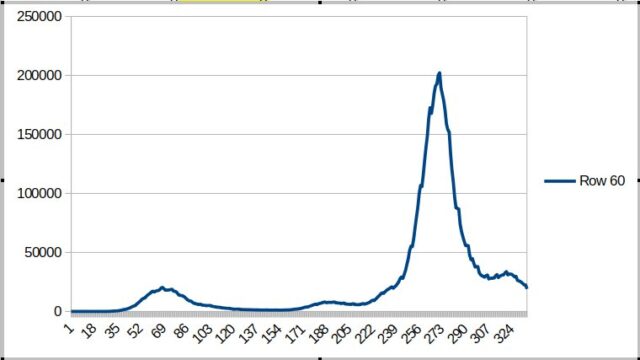
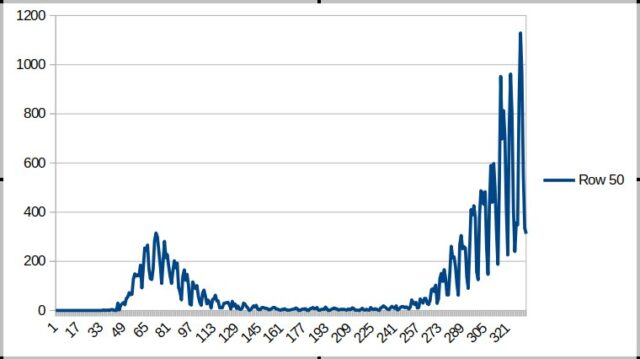
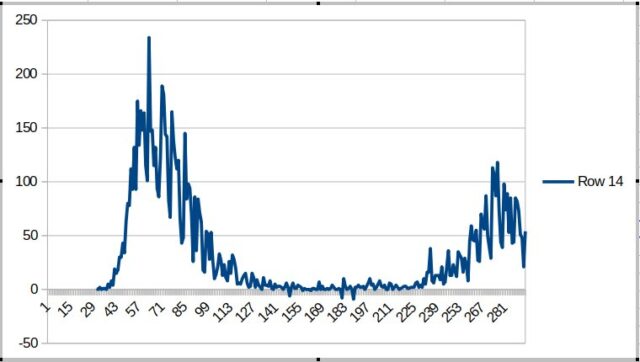
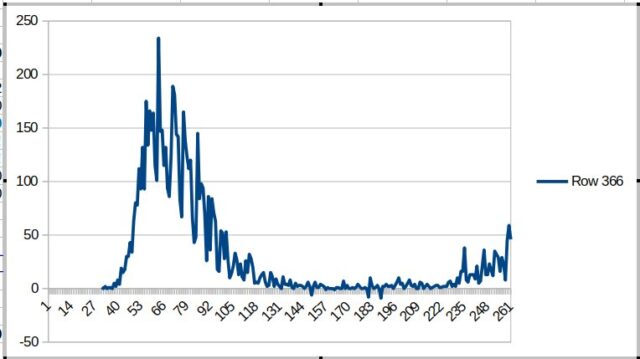
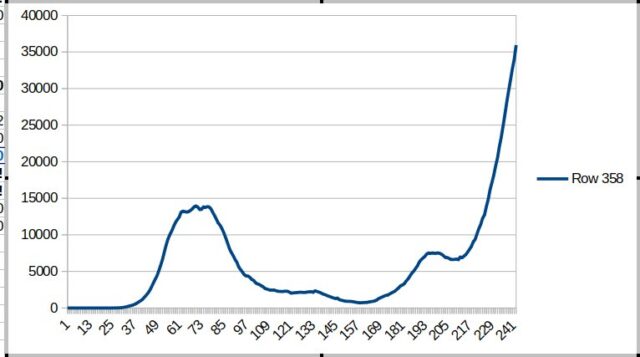
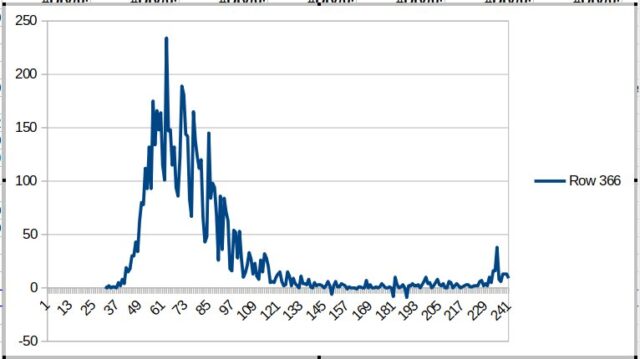
Number of people (still) sick on a given day
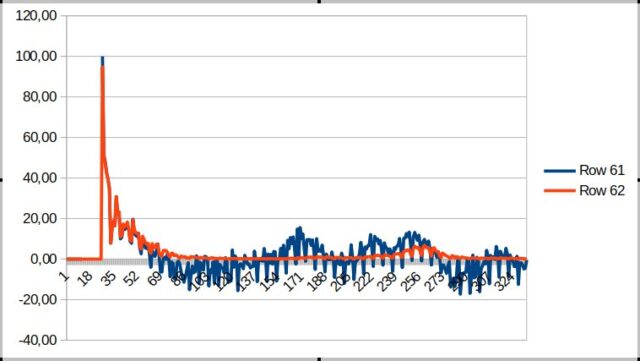
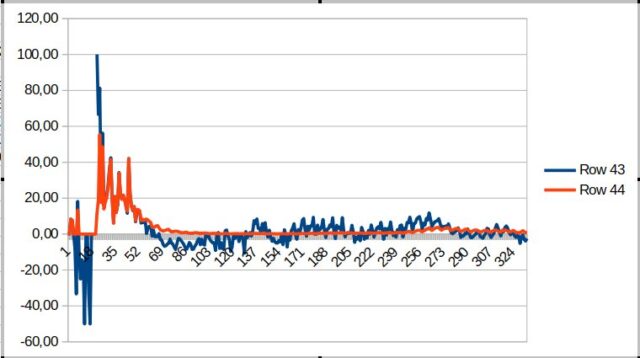
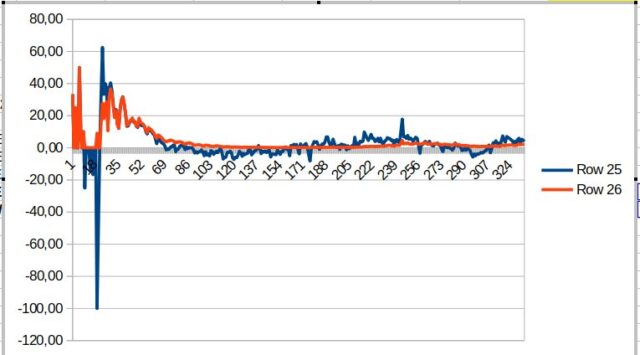
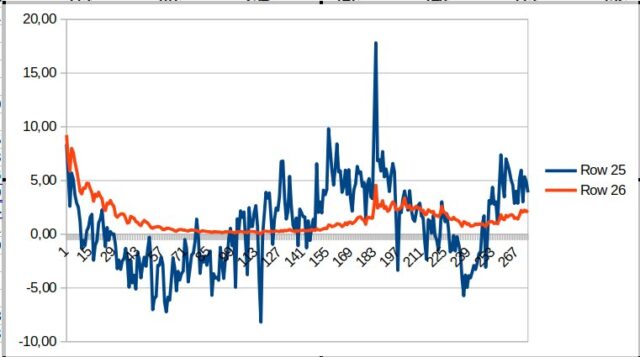
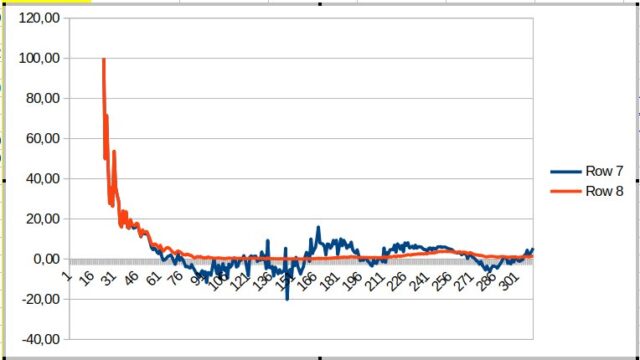
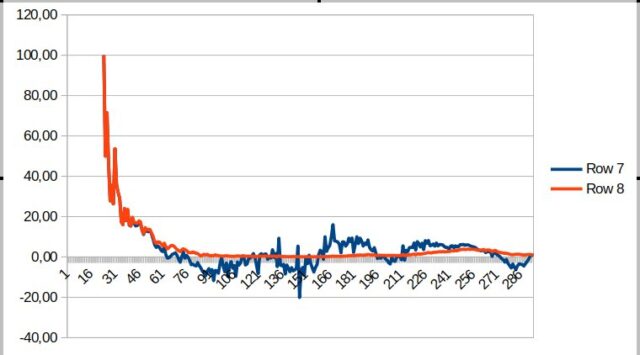
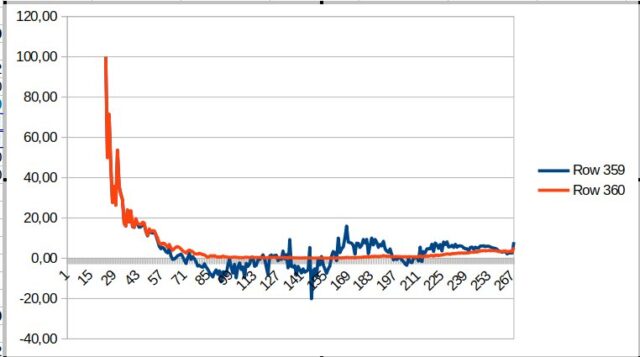
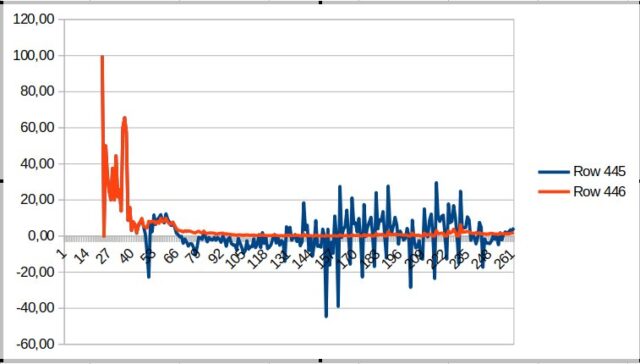
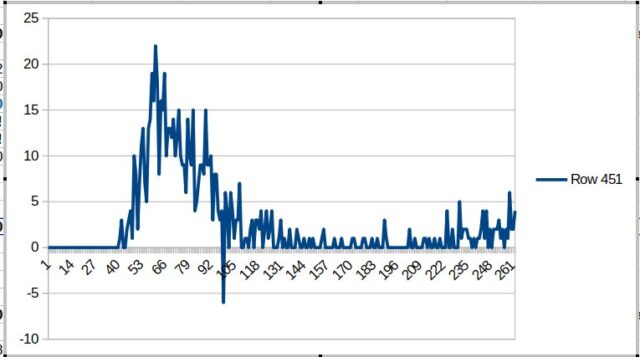
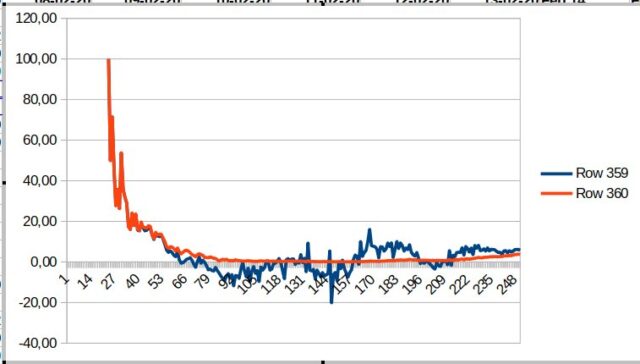
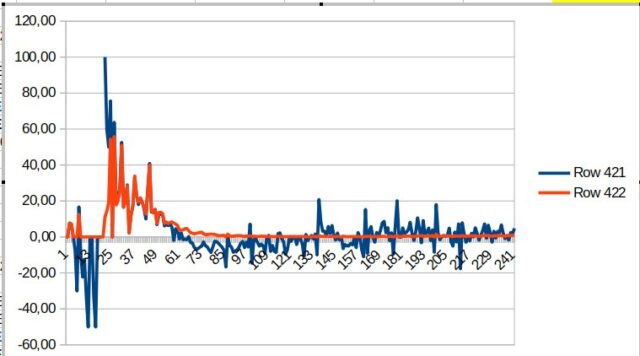
Reproduction number in % minus 1 on any given day (blue line).
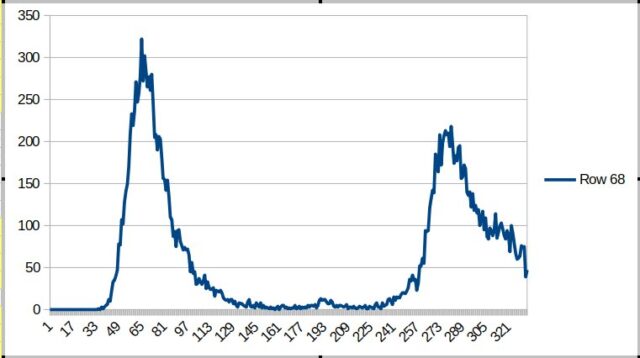
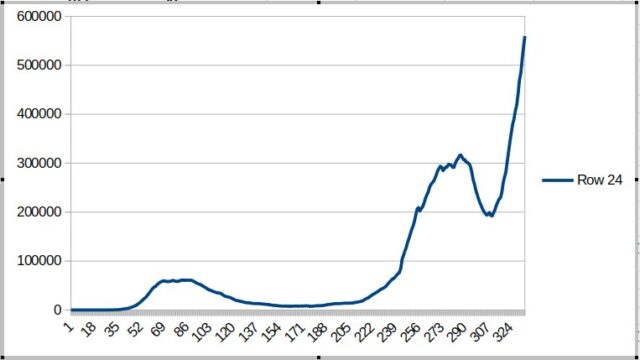
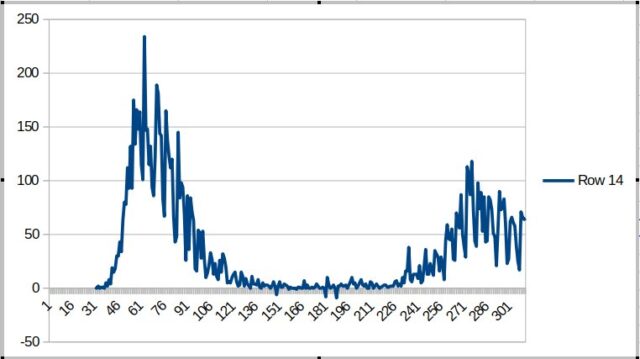
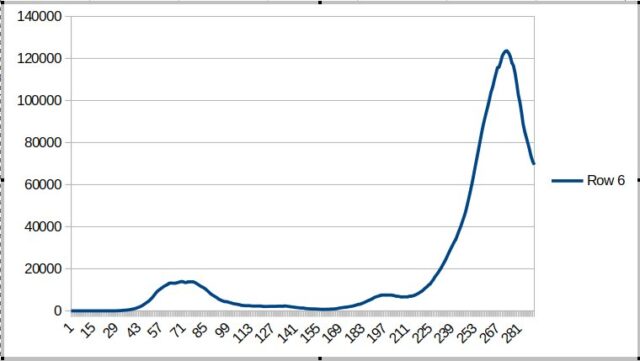
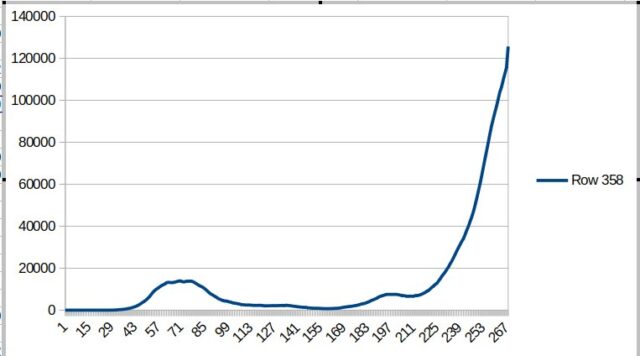
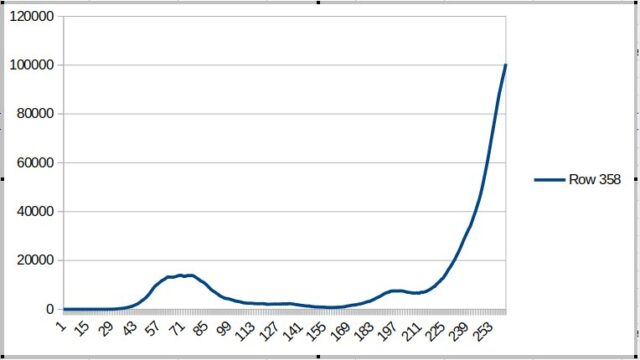
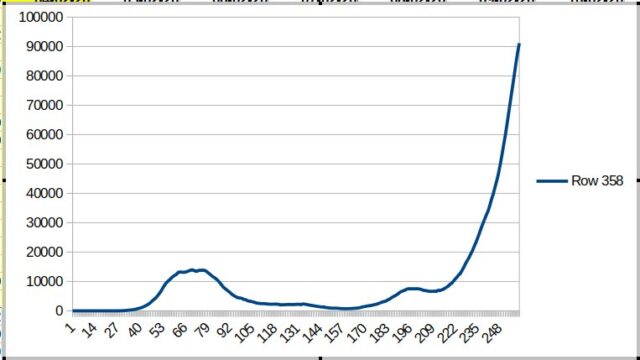
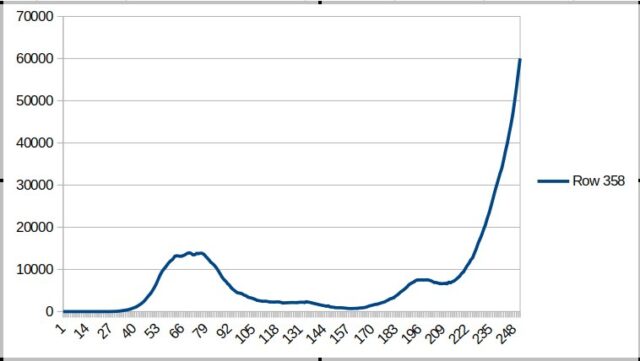
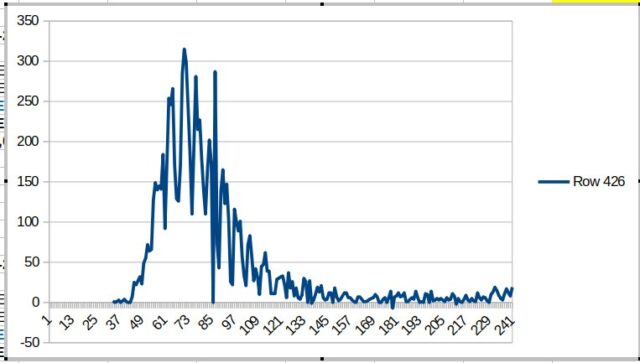
Number of deaths on a given day.
Own statistics based upon numbers supplied by WHO
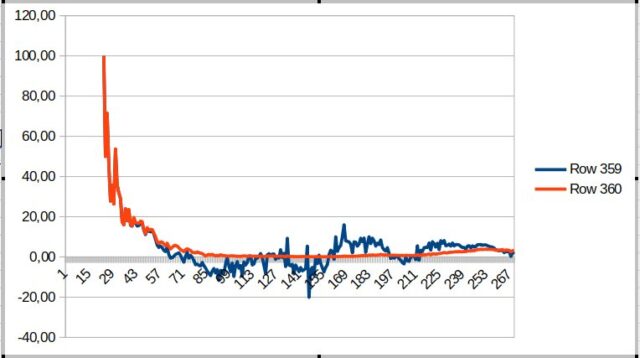
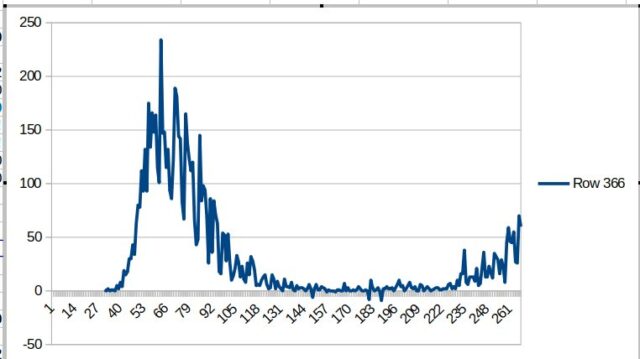
Charts are all for Belgium, from 5 Feb until 3 Jan 2021
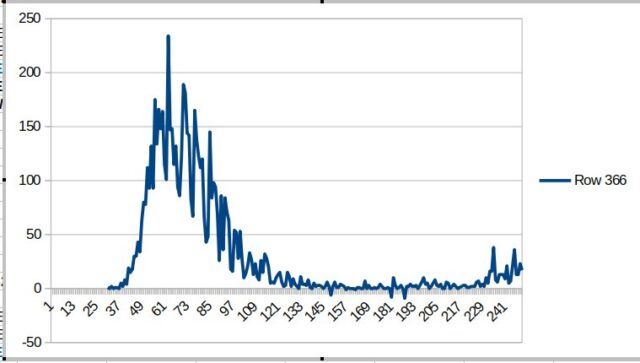
Number of people (still) sick on a given day
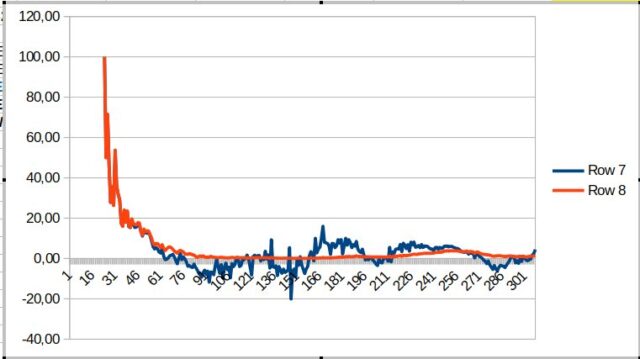
Reproduction number in % minus 1 on any given day (blue line).
Number of deaths on a given day.
Own statistics based upon numbers supplied by WHO
Charts are all for Germany, from 5 Feb until 3 Jan 2021
Number of people (still) sick on a given day
Reproduction number in % minus 1 on any given day (blue line).
Number of deaths on a given day.
Own statistics based upon numbers supplied by WHO
Charts are all for the UK, from 5 Feb until 3 Jan 2021
Number of people (still) sick on a given day
Reproduction number in % minus 1 on any given day (blue line).

Number of deaths on a given day.
Own statistics based upon numbers supplied by WHO
Made one extra of hte second chart this time, which starts from 5 April instead of 5 February:
Charts are all for the Netherlands, from 5 Feb until 2 Jan 2020
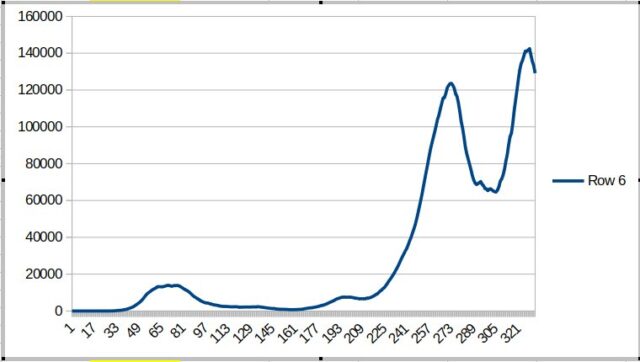
Number of people (still) sick on a given day
Reproduction number in % minus 1 on any given day (blue line).
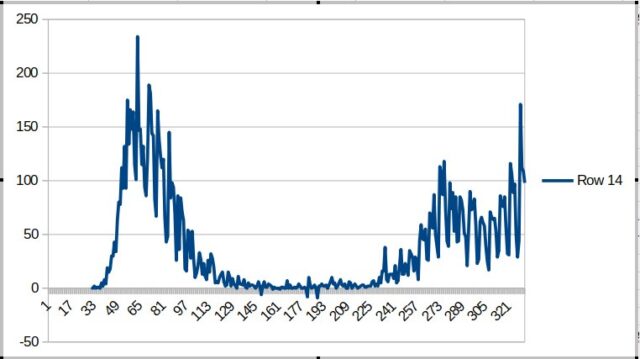
Number of deaths on a given day.
Own statistics based upon numbers supplied by WHO
Charts are all for the Netherlands, from 5 Feb until 12 Dec 2020
Number of people (still) sick on a given day
Reproduction number in % minus 1 on any given day (blue line).
Number of deaths on a given day.
Own statistics based upon numbers supplied by WHO
Charts are all for the Netherlands, from 5 Feb until 8 Dec 2020

Number of people (still) sick on a given day
Reproduction number in % minus 1 on any given day (blue line).
Number of deaths on a given day.
Own statistics based upon numbers supplied by WHO
Charts are all for the Netherlands, from 5 Feb until 21 Nov 2020

Number of people (still) sick on a given day
Reproduction number in % minus 1 on any given day (blue line).
Number of deaths on a given day.
Own statistics based upon numbers supplied by WHO
Charts are all for the Netherlands, from 5 Feb until 21 Nov 2020
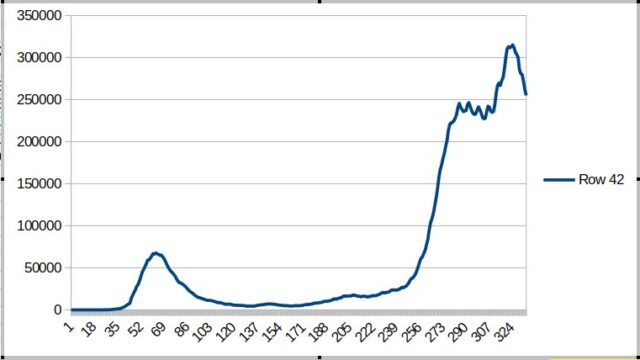
Number of people (still) sick on a given day
Reproduction number in % minus 1 on any given day (blue line).
Number of deaths on a given day.
Own statistics based upon numbers supplied by WHO
Charts are all for the Netherlands, from 5 Feb until 31 Oct 2020
Number of people (still) sick on a given day.
Reproduction number in % minus 1 on any given day (blue line).
Number of deaths on a given day.
Own statistics based upon numbers supplied by WHO
Charts are all for the Netherlands, from 5 Feb until 29 Oct 2020
Number of people (still) sick on a given day.
Reproduction number in % minus 1 on any given day (blue line).
Number of deaths on a given day.
Own statistics based upon numbers supplied by WHO
Case fatality rate is the percentage of people getting ill from COVID-19 that die in a certain country
Numbers are of 19 October 2020
| Country | Case fatality rate | |
| 1 | Italy | 8,8% |
| 2 | Ecuador | 8,1% |
| 3 | Chad | 6,9% |
| 4 | Bolivia | 6,1% |
| 5 | Sudan | 6,1% |
| 6 | United Kingdom | 6,0% |
| 7 | Liberia | 6,0% |
| 8 | Egypt | 5,8% |
| 9 | Sweden | 5,7% |
| 10 | Iran | 5,7% |
| 11 | Niger | 5,7% |
| 12 | San Marino | 5,5% |
| 13 | China | 5,2% |
| 14 | Canada | 5,1% |
| 15 | Syria | 4,8% |
| 16 | Belgium | 4,7% |
| 17 | Ireland | 4,1% |
| 18 | Tanzania | 4,1% |
| 19 | Kosovo | 4,0% |
| 20 | Peru | 3,9% |
| 21 | Mali | 3,9% |
| 22 | France | 3,8% |
| 23 | Afghanistan | 3,7% |
| 24 | Spain | 3,6% |
| 25 | North Macedonia | 3,5% |
| 26 | Guatemala | 3,5% |
| 27 | Bulgaria | 3,5% |
| 28 | Indonesia | 3,5% |
| 29 | Romania | 3,4% |
| 30 | Algeria | 3,4% |
| 31 | Australia | 3,3% |
| 32 | Barbados | 3,3% |
Click ‘Continue reading’ to see the complete list
| Numbers are of 19 October 2020 | ||
| Country | Deaths per 100.000 population | |
| 1 | San Marino | 124,32 |
| 2 | Peru | 105,35 |
| 3 | Belgium | 91,17 |
| 4 | Andorra | 76,62 |
| 5 | Bolivia | 74,7 |
| 6 | Brazil | 73,36 |
| 7 | Chile | 72,8 |
| 8 | Ecuador | 72,5 |
| 9 | Spain | 72,29 |
| 10 | Mexico | 68,28 |
| 11 | United States | 67,14 |
| 12 | United Kingdom | 65,78 |
| 13 | Panama | 61,39 |
| 14 | Italy | 60,47 |
| 15 | Argentina | 59,03 |
| 16 | Colombia | 58,35 |
| 17 | Sweden | 58,12 |
| 18 | France | 49,75 |
| 19 | Moldova | 44,67 |
| 20 | North Macedonia | 40,04 |
| 21 | Netherlands | 39,53 |
| 22 | Ireland | 37,81 |
| 23 | Iran | 35,88 |
| 24 | Kosovo | 35,22 |
| 25 | Armenia | 35,2 |
| 26 | Montenegro | 34,87 |
| 27 | South Africa | 31,41 |
| 28 | Bosnia and Herzegovina | 28,82 |
| 29 | Romania | 28,76 |
| 30 | Bahamas | 28,26 |
| 31 | Honduras | 26,42 |
| 32 | Canada | 26,23 |
Click on ‘Continue reading’ to see the complete list
Charts are all for the Netherlands, from 5 Feb until 23 Oct 2020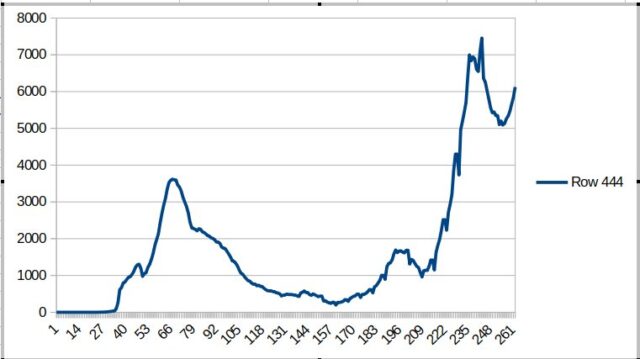
Number of people (still) sick on a given day.
Reproduction number in % minus 1 on any given day (blue line).
Number of deaths on a given day.
Own statistics based upon numbers supplied by WHO
Charts are all for the Netherlands, from 5 Feb until 23 Oct 2020
Number of people (still) sick on a given day. To the left of the graph you can see the maximum of last spring.
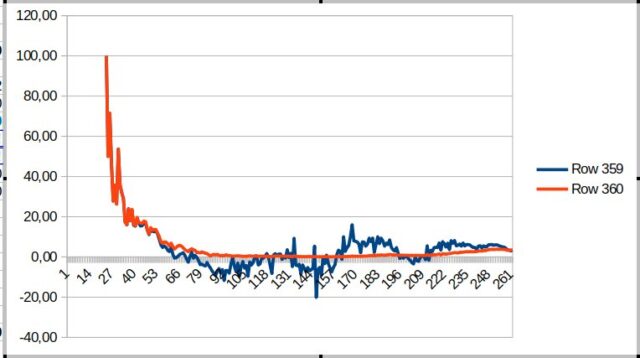
Reproduction number minus 1 on any given day (blue line).
Number of deaths on a given day.
Own statistics based upon numbers supplied by WHO
Charts are all for the Netherlands, from 5 Feb until 20 Oct 2020
Number of people (still) sick on a given day. To the left of the graph you can see the maximum of last spring.
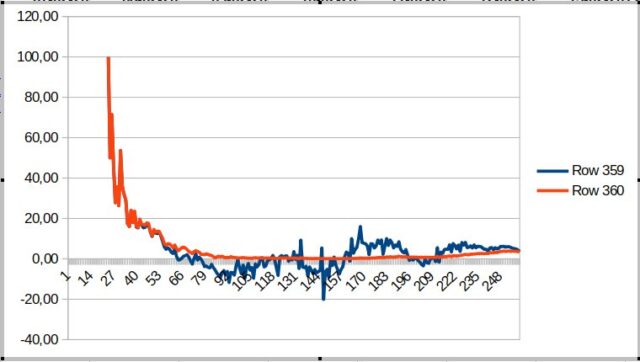
Reproduction number minus 1 on any given day (blue line).
Number of deaths on a given day.
Charts are all for the Netherlands, from 5 Feb until 12 Oct 2020
Number of people (still) sick on a given day. To the left of the graph you can see the maximum of last spring.
Reproduction number minus 1 on any given day (blue line).
Number of deaths on a given day.
Total number of confirmed cases world wide: 34,161,721.
Time to double the number of cases: 63
Confirmed cases per country:
| 1 | USA | 7,160,476 | ||||
| 2 | India | 6,394,068 | ||||
| 3 | Brazil | 4,810,935 | ||||
| 4 | Russia | 1,194,643 | ||||
| 5 | Colombia | 829,679 | ||||
| 6 | Peru | 814,829 | ||||
| 7 | Spain | 778,607 | ||||
| 8 | Argentina | 751,001 | ||||
| 9 | Mexico | 743,216 | ||||
| 10 | South Africa | 676,084 | ||||
| 11 | France | 552,249 | ||||
| 12 | Chile | 464,750 | ||||
| 13 | Iran | 461,044 | ||||
| 14 | UK | 460,182 | ||||
| 15 | Iraq | 367,474 | ||||
| 16 | Bangladesh | 364,987 | ||||
| 17 | Saudi Arabia | 335,097 | ||||
| 18 | Turkey | 320,070 | ||||
| 19 | Italy | 317,409 | ||||
| 20 | Philippines | 314,079 | ||||
| 21 | Pakistan | 313,431 | ||||
| 22 | Germany | 294,395 | ||||
| 23 | Indonesia | 291,182 | ||||
| 24 | Israel | 238,452 | ||||
| 25 | Ukraine | 217,661 | ||||
| 26 | Canada | 158,758 | ||||
| 27 | Kazakhstan | 140,957 | ||||
| 28 | Ecuador | 138,584 | ||||
| 29 | Bolivia | 135,311 | ||||
| 30 | Romania | 129,658 | ||||
| 31 | Morocco | 126,044 | ||||
| 32 | Qatar | 125,959 |
Worldwide there are 1,016,986 fatalities from COVID-19 until today.
Currently the number of deaths doubles in 94 days.
List of registered deaths per country.
| 1 | USA | 205,666 | ||||
| 2 | Brazil | 143,952 | ||||
| 3 | India | 99,773 | ||||
| 4 | Mexico | 77,646 | ||||
| 5 | UK | 42,202 | ||||
| 6 | Italy | 35,918 | ||||
| 7 | Peru | 32,463 | ||||
| 8 | Spain | 31,973 | ||||
| 9 | France | 31,808 | ||||
| 10 | Iran | 26,380 | ||||
| 11 | Colombia | 25,998 | ||||
| 12 | Russia | 21,077 | ||||
| 13 | Argentina | 16,937 | ||||
| 14 | South Africa | 16,866 | ||||
| 15 | Chile | 12,822 | ||||
| 16 | Ecuador | 11,433 | ||||
| 17 | Indonesia | 10,856 | ||||
| 18 | Belgium | 10,023 | ||||
| 19 | Germany | 9,508 | ||||
| 20 | Canada | 9,297 | ||||
| 21 | Iraq | 9,231 | ||||
| 22 | Turkey | 8,262 | ||||
| 23 | Bolivia | 7,965 | ||||
| 24 | Pakistan | 6,499 | ||||
| 25 | Netherlands | 6,410 | ||||
| 26 | Egypt | 5,946 | ||||
| 27 | Sweden | 5,893 | ||||
| 28 | Philippines | 5,562 | ||||
| 29 | Bangladesh | 5,272 | ||||
| 30 | Romania | 4,862 | ||||
| 31 | Saudi Arabia | 4,794 | ||||
| 32 | China | 4,746 |
Charts are all for the Netherlands, from 5 Feb until 4 Oct 2020
Number of people (still) sick on a given day.
The reproduction number minus 1 on any given day (blue line).
Number of deaths on a given day.
Charts are all for the Netherlands, from 5 Feb until 4 Oct 2020
Number of people (still) sick on a given day. To the left of the graph you can see the maximum of last spring. The number of sick people is now almost three times the number of then.
—
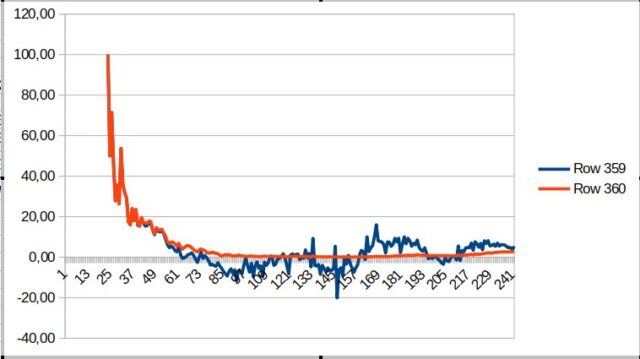
The reproduction number minus 1 on any given day (blue line). What is striking is that it seems that the reproduction is on its way back to below 0. In other words, in that case the numbers will decrease again. More than a month ago there was also such a dip, and before that the numbers rose faster than in recent weeks.
This could be an early sign that measures over the past two weeks are working. In any case, the situation seems better than a month or so ago.
—
Number of deaths on a given day. This is higher than 2 weeks or so ago, but that is to be expected with so many people infected. The peak in the graph is an explainable peak for statistical reasons, which is of no great significance. What counts is the average line.