Charts are all for the Netherlands, from 5 Feb until 4 Oct 2020
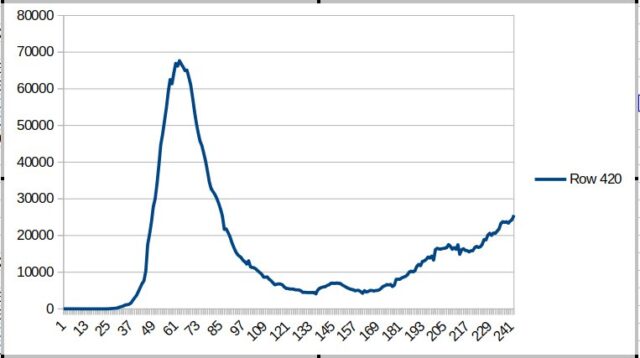
Number of people (still) sick on a given day.
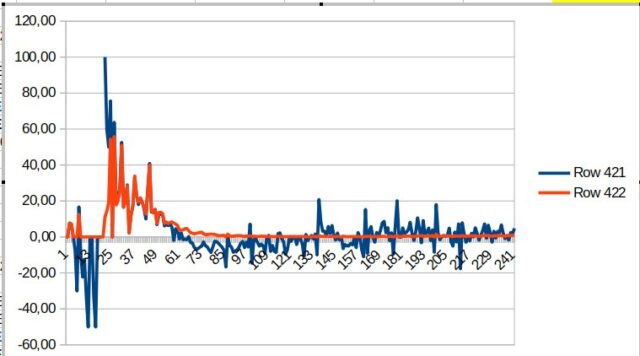
The reproduction number minus 1 on any given day (blue line).
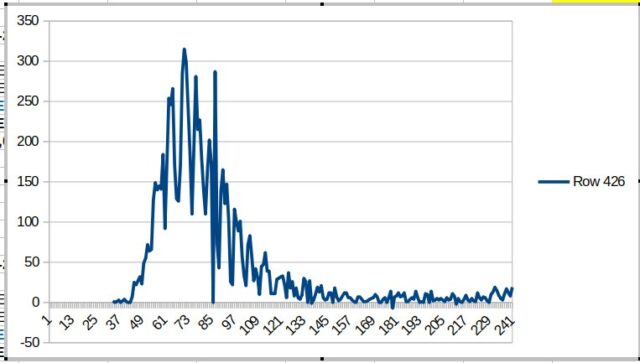
Number of deaths on a given day.
Charts are all for the Netherlands, from 5 Feb until 4 Oct 2020
Number of people (still) sick on a given day.
The reproduction number minus 1 on any given day (blue line).
Number of deaths on a given day.