Charts are all for the Netherlands, from 5 Feb until 22 Sep 2020
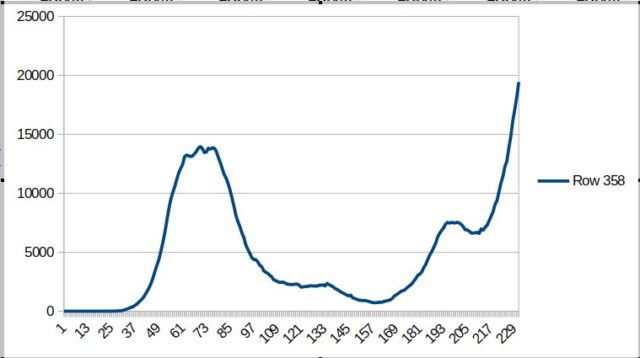
Number of people (still) ill on an certain day
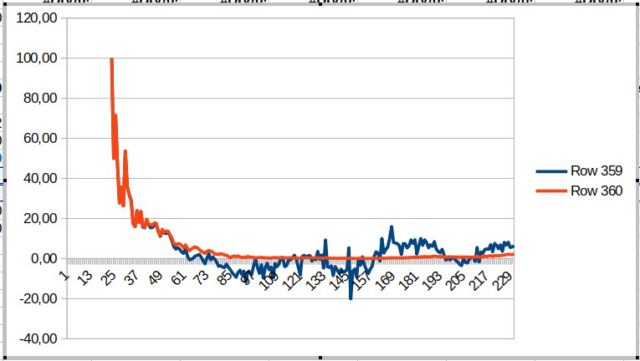
Reproduction number minus one (blue line)
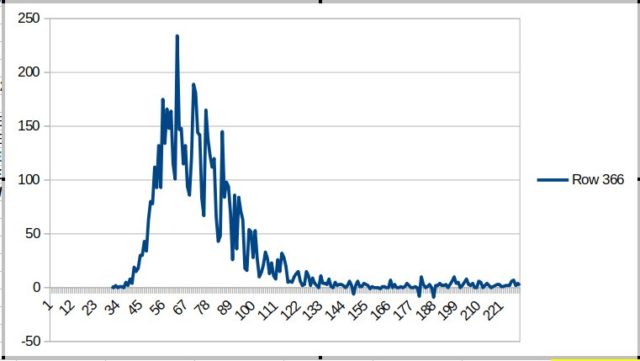
Number of deaths over the same time span
Charts are all for the Netherlands, from 5 Feb until 22 Sep 2020
Number of people (still) ill on an certain day
Reproduction number minus one (blue line)
Number of deaths over the same time span