Charts are from 5 Feb until 3 Aug 2020
Charts are from 5 Feb until 31 July 2020. Still no improvement…
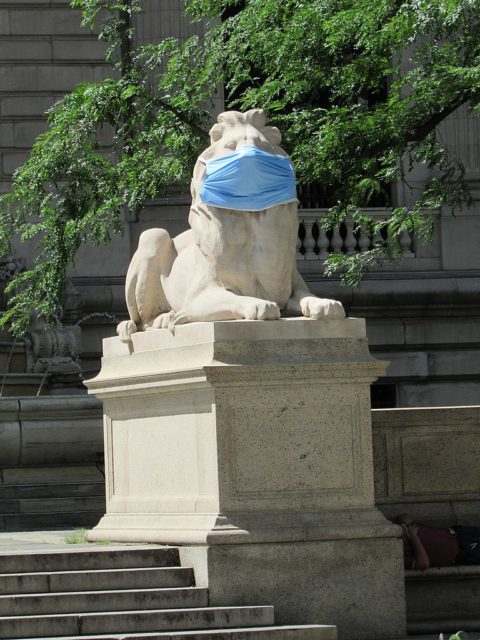
Fortitude With Face Mask, photo: Eden, Janine and Jim from New York City

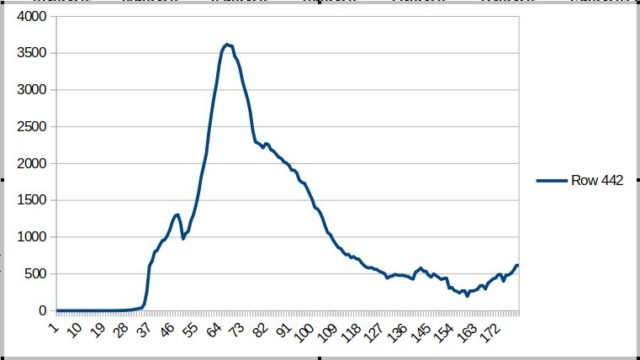
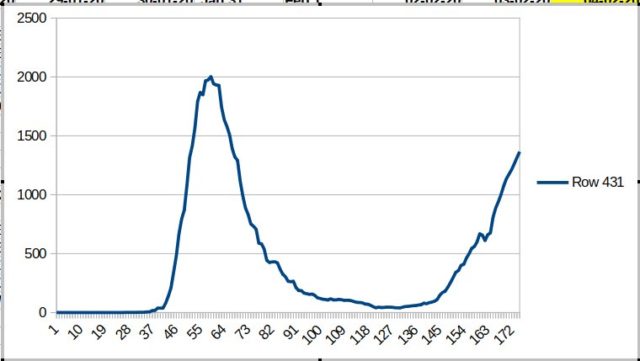
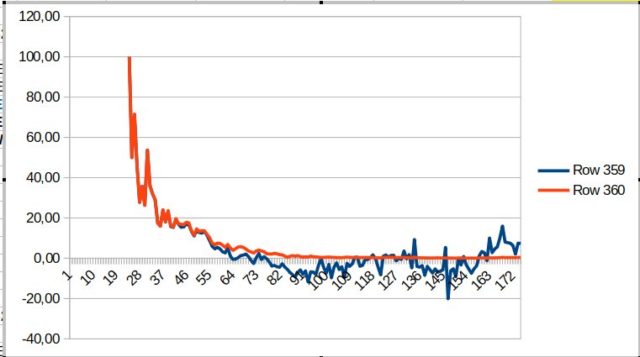
Luxembourg is doing really bad. Clearly going towards a second peak.
Looking at the charts for Luxembourg however you can see that the beginning of the second rising looks eerily similar to the chatt of yesterday of the Netherlands.
A second peak generally develops within 10 days or so. That would mean that the Netherlands could be in the stage where Luxembourg is now within 8 days.
Realizing this, is quite shocking. The image of today however doesn’t have to mean that a second peak in the Netherlands is imminent. It could just as well mean that this is a normal temporated rise due to the lifting of some measures on July 1st.
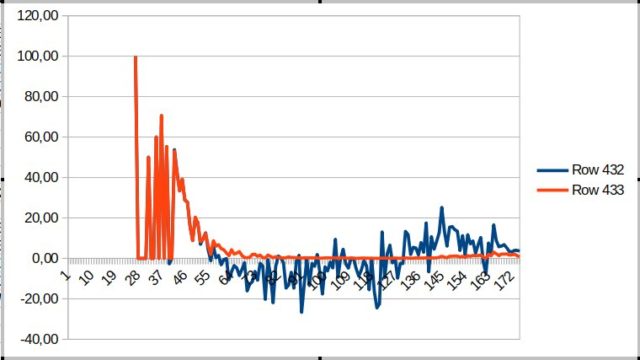
Luxembourg, blue line is repdoduction: positive is rise, below the zero line is decline. Feb 5 to 28 July

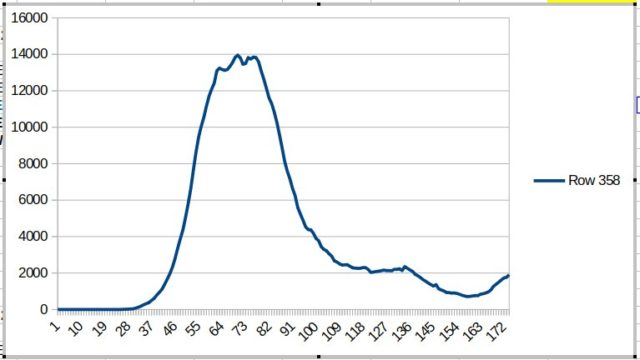
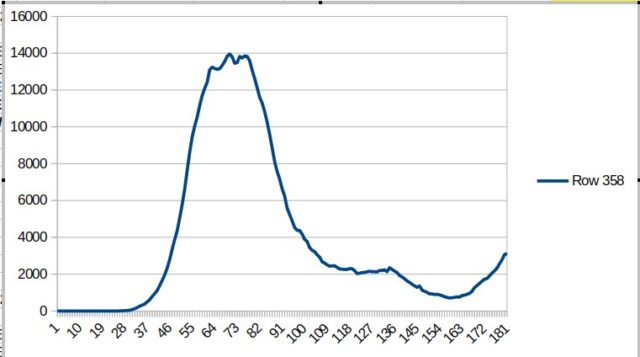
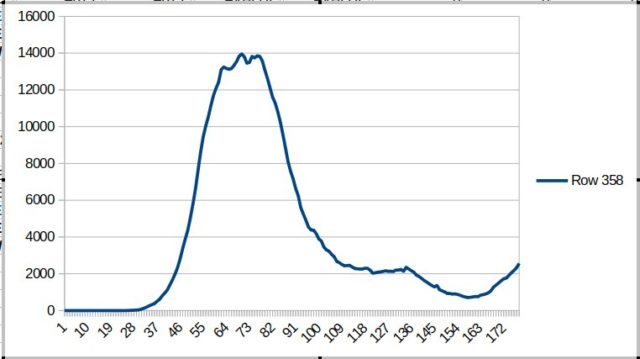
Netherlands, people (still) ill Feb 5 to 28 July
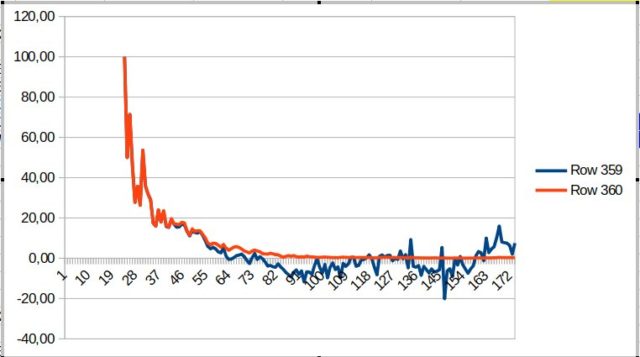
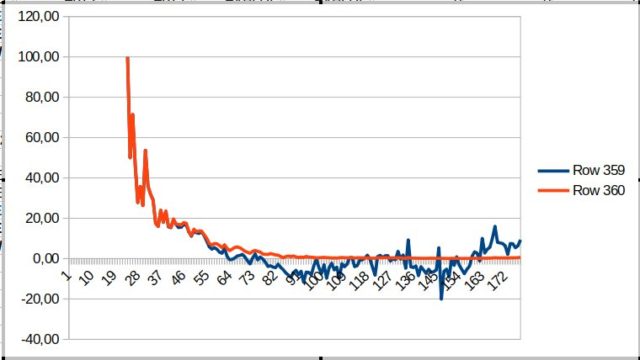
Netherlands, blue line is repdoduction: positive is rise, below the zero line is decline. Feb 5 to 28 July
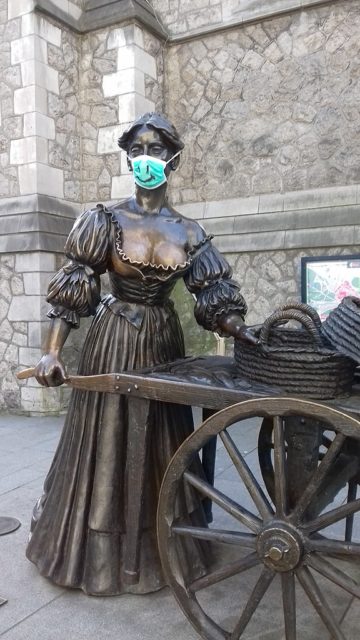
Statue of “Molly Malone” in St Andrew’s Street, Dublin. March 2020 during the COVID-19 pandemic. Molly is wearing a mask with a smiley face drawn on it. Photo: Laurel Lodged


A metal statue of an American elk (wapiti) has been adorned with a cloth face mask like those worn to stop the spread of SARS-CoV-2.Photo: Lorie Shaull from St Paul, United States
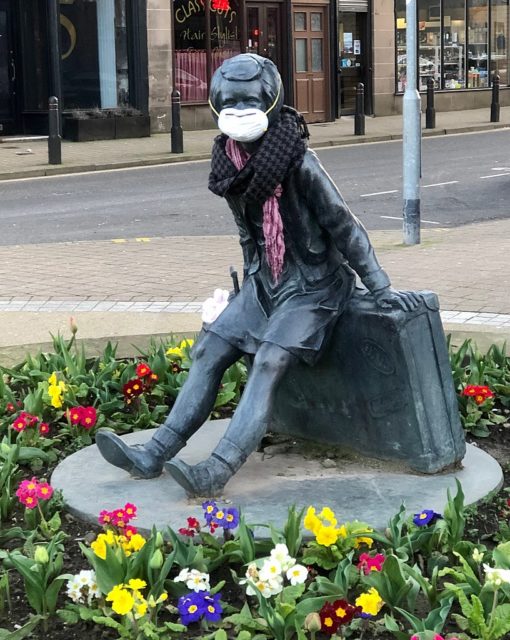
Wee Annie statue at end of Kempock Street, Gourock, with face mask during COVID-19 pandemic. Photo Dave Ssouza
Charts are from 5 Feb until 27 July 2020