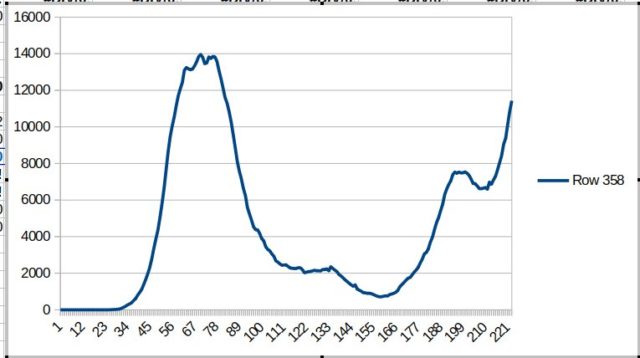
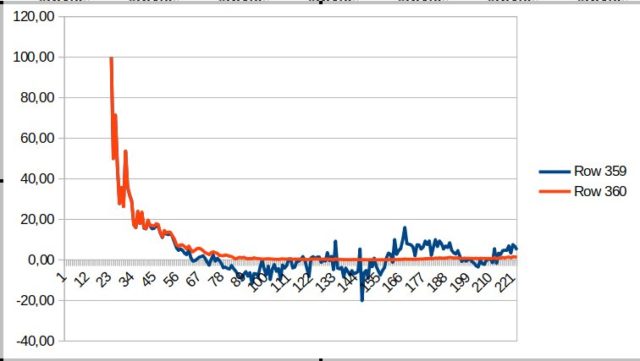
Charts are from 5 Feb until 14 Sep 2020

Number of people (still) ill on a certain date (see above)

Blue line is reprodution. Add 1 to obtain the reproduction number as used by for example Dutch RIVM.
Charts are from 5 Feb until 14 Sep 2020

Number of people (still) ill on a certain date (see above)

Blue line is reprodution. Add 1 to obtain the reproduction number as used by for example Dutch RIVM.