Charts are all for the Netherlands, from 5 Feb until 12 Oct 2020
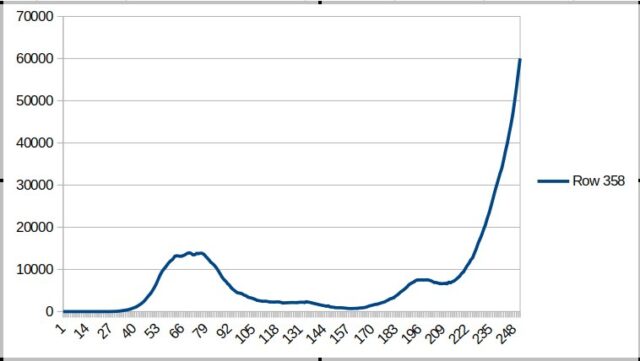
Number of people (still) sick on a given day. To the left of the graph you can see the maximum of last spring.
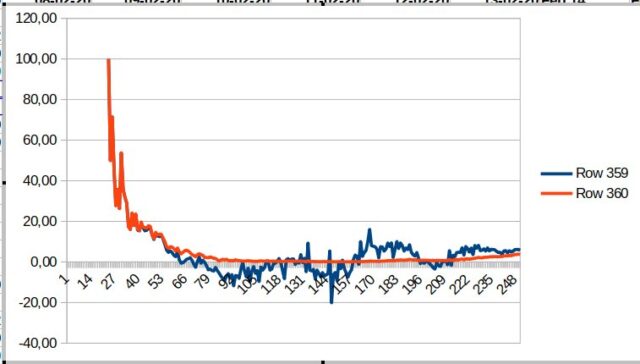
Reproduction number minus 1 on any given day (blue line).
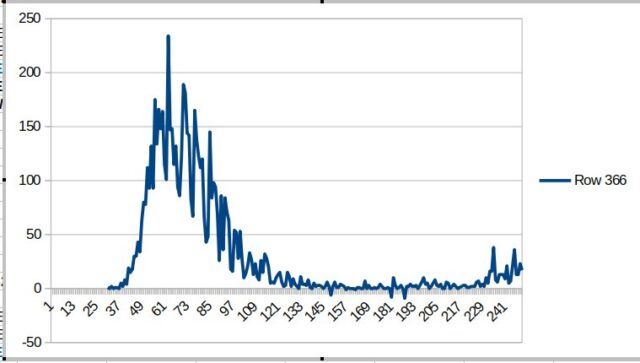
Number of deaths on a given day.