Luxembourg is doing really bad. Clearly going towards a second peak.
Looking at the charts for Luxembourg however you can see that the beginning of the second rising looks eerily similar to the chatt of yesterday of the Netherlands.
A second peak generally develops within 10 days or so. That would mean that the Netherlands could be in the stage where Luxembourg is now within 8 days.
Realizing this, is quite shocking. The image of today however doesn’t have to mean that a second peak in the Netherlands is imminent. It could just as well mean that this is a normal temporated rise due to the lifting of some measures on July 1st.
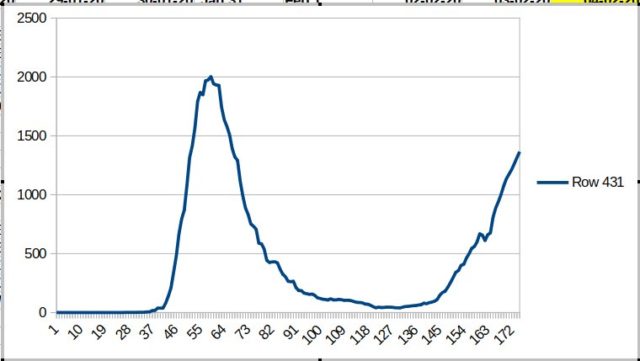
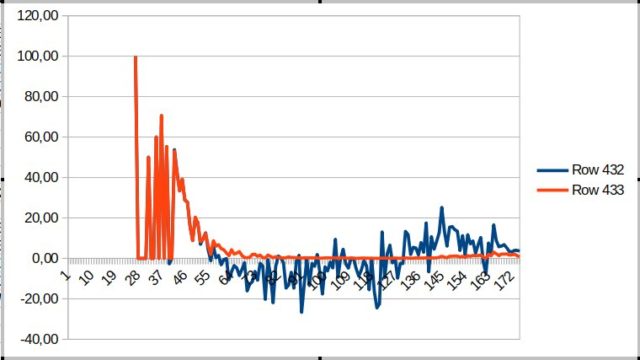
Luxembourg, blue line is repdoduction: positive is rise, below the zero line is decline. Feb 5 to 28 July
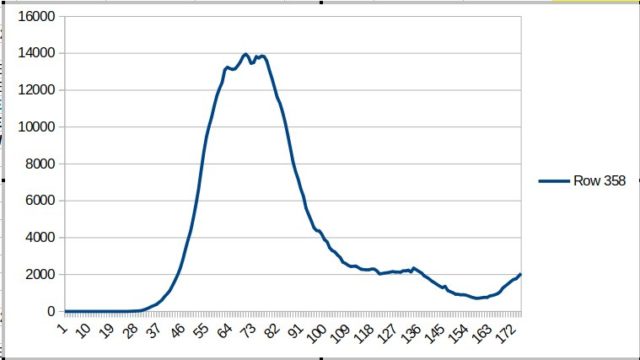
Netherlands, people (still) ill Feb 5 to 28 July
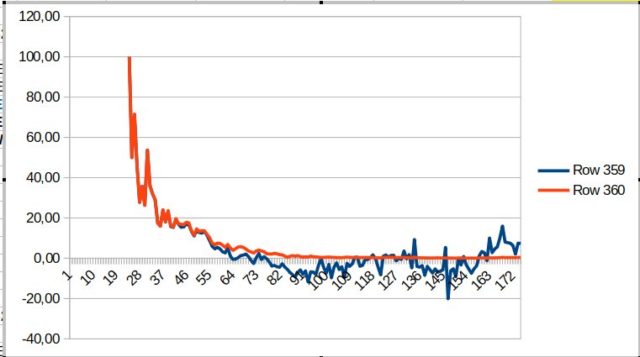
Netherlands, blue line is repdoduction: positive is rise, below the zero line is decline. Feb 5 to 28 July