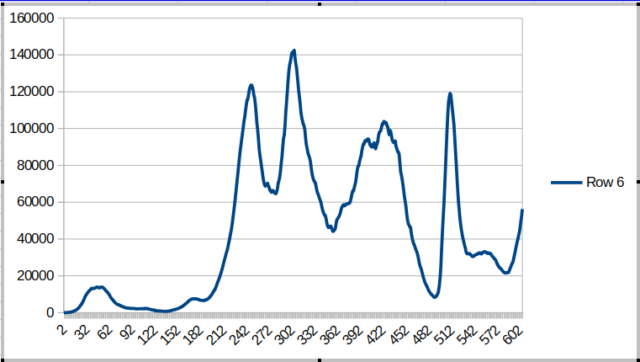
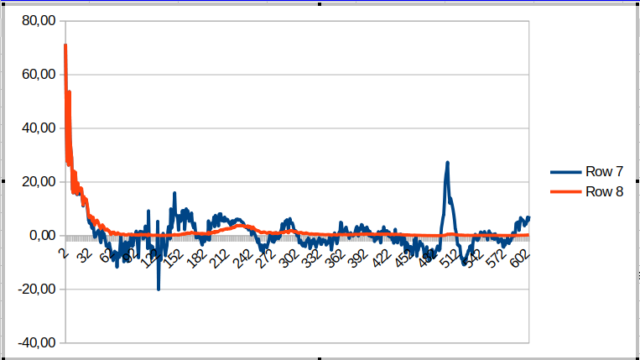
Netherlands, from 5 Feb 2020 until 8 Jul 2021
Number of people (still) sick on a given day

Reproduction number in % minus 1 on any given day (blue line).
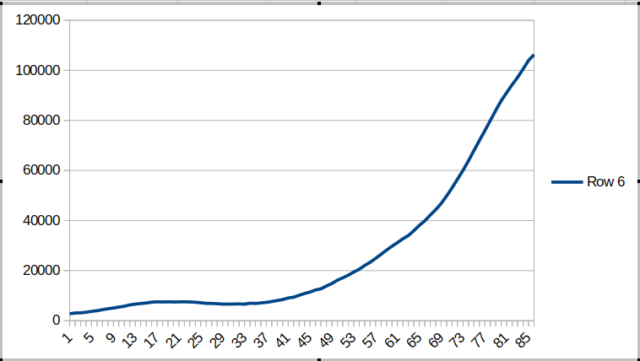
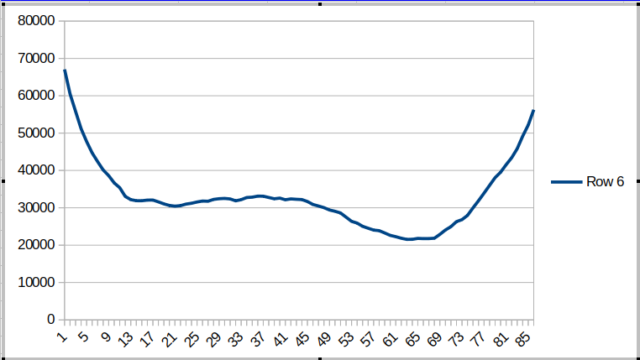
Below: Comparison people (still) ill between 1 August and 25 October 2020 (upper chart) and between 1 August and 25 October 2021 (lower chart)

Above: 1 August and 25 October 2020

Above: 1 August and 25 October 2021