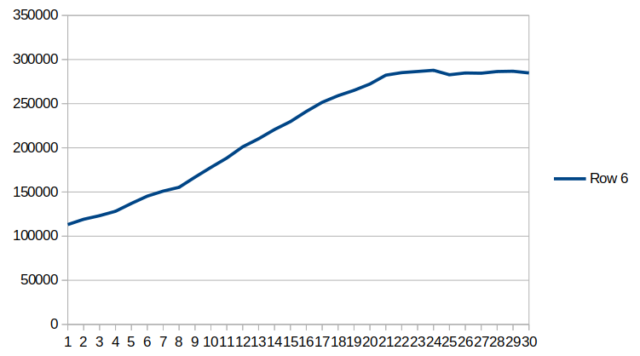
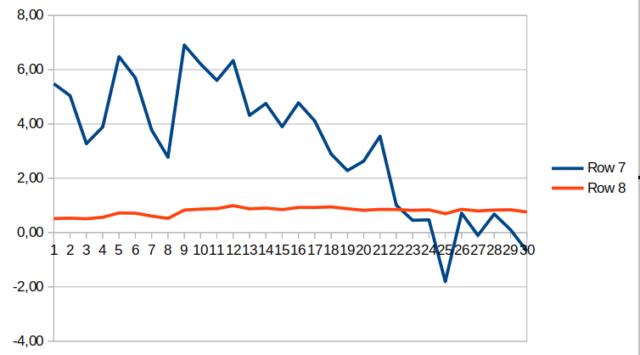
Charts below are for Netherlands, from 8 Nov. 2021 until 7 Dec. 2021 (one month)
Above chart: Number of people (still) ill on a given day (last month)

Above chart: Reproduction number in % minus 1 on any given day (blue line). (last month)
Charts below are for Netherlands, from 8 Nov. 2021 until 7 Dec. 2021 (one month)
Above chart: Number of people (still) ill on a given day (last month)

Above chart: Reproduction number in % minus 1 on any given day (blue line). (last month)