Monthly Archives: juli 2020
Daily Minutes 30 July 2020 Mondkapjes (Dutch)
Data broadcast of 29 July 2020, please use Fldigi and set RxID on
Data broadcast of 28 July 2020, please use Fldigi and set RxID on
Daily Minutes 28 July 2020, Dutch comments and English news
Data broadcast of 27 July 2020, SSTV and Fldigi
Data broadcast of 26 July 2020, please use Fldigi and set RxID on
Daily Face Mask Photo #4, 29 July 2020

Fortitude With Face Mask, photo: Eden, Janine and Jim from New York City
Dagelijkse foto 2-12 (29 juli 2020)

Some more charts
Luxembourg is doing really bad. Clearly going towards a second peak.
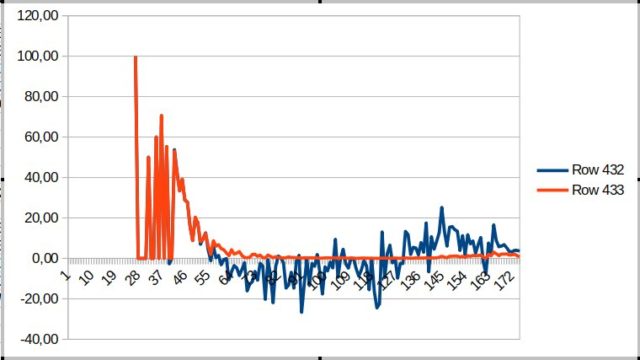
Looking at the charts for Luxembourg however you can see that the beginning of the second rising looks eerily similar to the chatt of yesterday of the Netherlands.
A second peak generally develops within 10 days or so. That would mean that the Netherlands could be in the stage where Luxembourg is now within 8 days.
Realizing this, is quite shocking. The image of today however doesn’t have to mean that a second peak in the Netherlands is imminent. It could just as well mean that this is a normal temporated rise due to the lifting of some measures on July 1st.
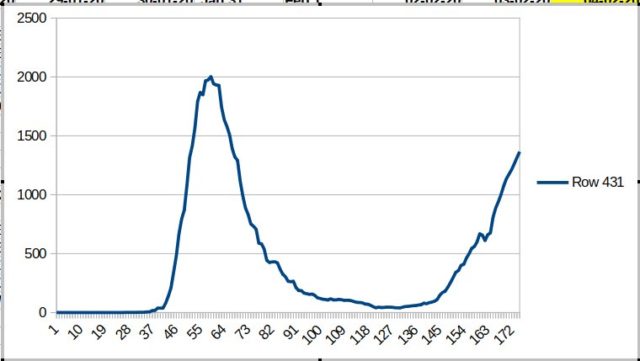
Luxembourg, blue line is repdoduction: positive is rise, below the zero line is decline. Feb 5 to 28 July
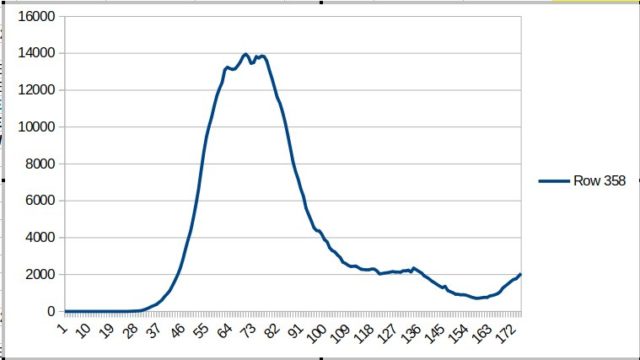
Netherlands, people (still) ill Feb 5 to 28 July
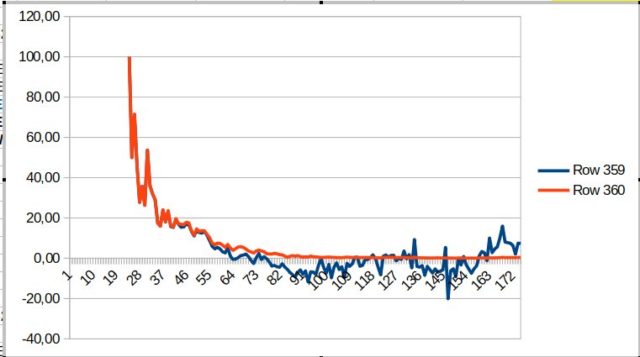
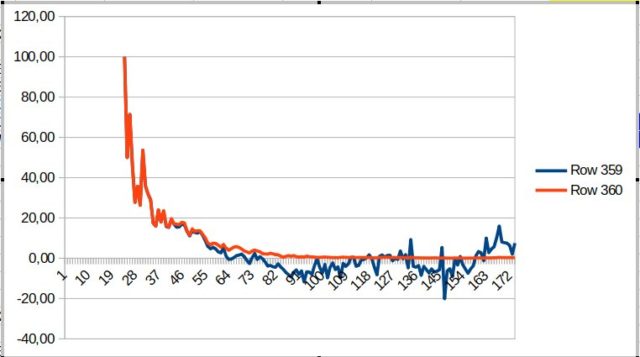
Netherlands, blue line is repdoduction: positive is rise, below the zero line is decline. Feb 5 to 28 July
Daily Face Mask Photo #3, 28 July 2020

Statue of “Molly Malone” in St Andrew’s Street, Dublin. March 2020 during the COVID-19 pandemic. Molly is wearing a mask with a smiley face drawn on it. Photo: Laurel Lodged
Dagelijkse foto 2-11 (28 juli 2020)
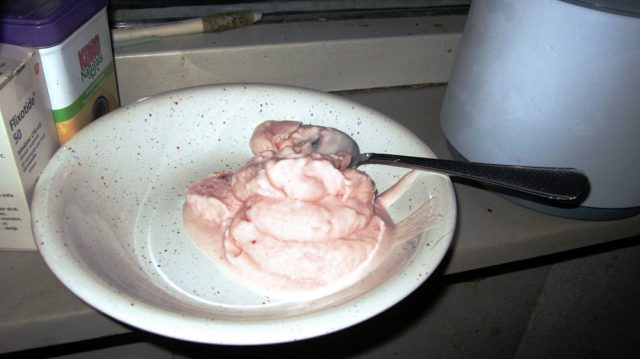
New! Daily Face Mask Photo #2, 27 July 2020

A metal statue of an American elk (wapiti) has been adorned with a cloth face mask like those worn to stop the spread of SARS-CoV-2.Photo: Lorie Shaull from St Paul, United States
New! Daily Face Mase Photo #1, 26 July 2020

Wee Annie statue at end of Kempock Street, Gourock, with face mask during COVID-19 pandemic. Photo Dave Ssouza
Dagelijkse foto 2-10 (27 juli 2020)
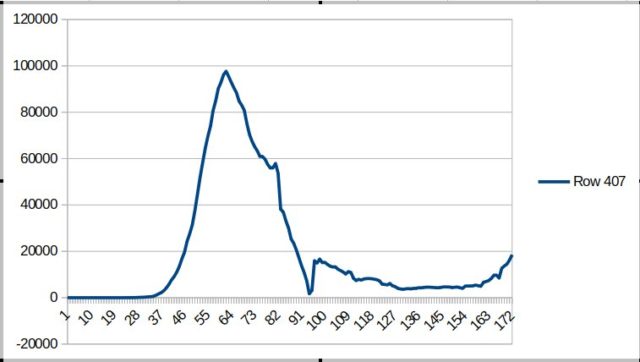
State of the Pandemic (Netherlands, another update)
Charts are from 5 Feb until 27 July 2020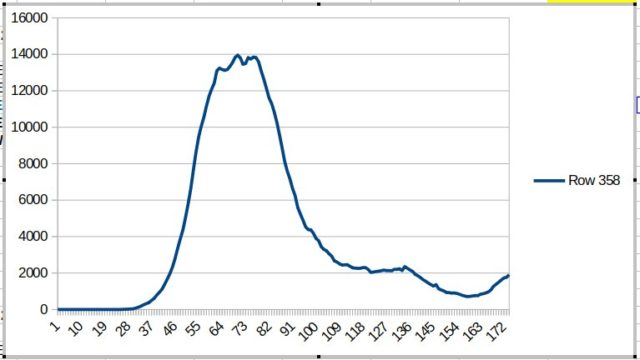
Dagelijkse foto 2-09 (26 juli 2020)
Dagelijkse foto 2-08 (25 juli 2020)
State of the Pandemic (Netherlands, update)
Charts are from 5 Feb until 25 July 2020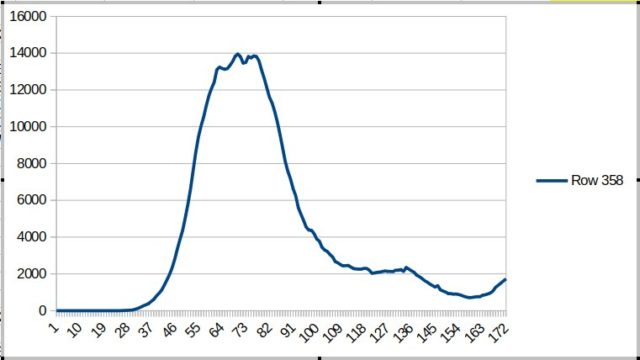
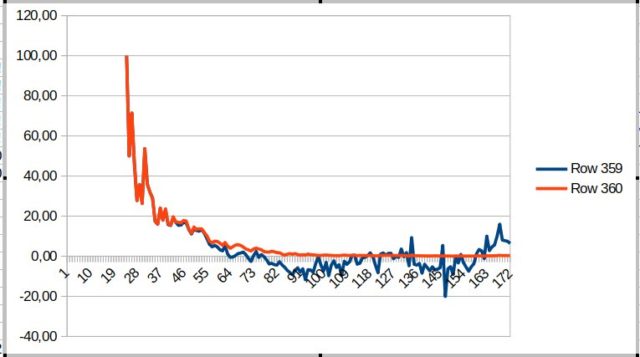
The blue line in the chart below stands for the reproduction number of the virus in the country. If above zero, numbers ar on the rise, if below zero they decline. Blue line of the chart below is an immediate sign for what is happening. They work out in the first chart within 1,5 to 2 weeks because of the incubation time.
