Daily Archives: 26 juli 2020
Dagelijkse foto 2-08 (25 juli 2020)
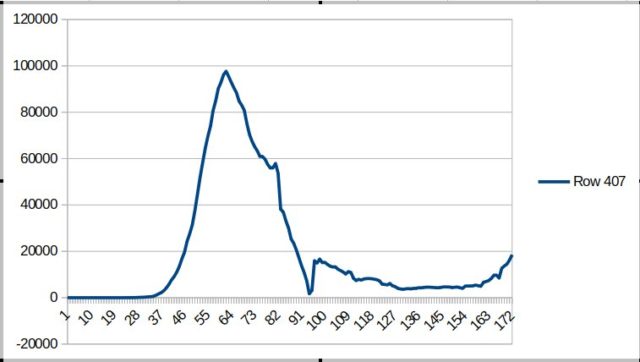
State of the Pandemic (Netherlands, update)
Charts are from 5 Feb until 25 July 2020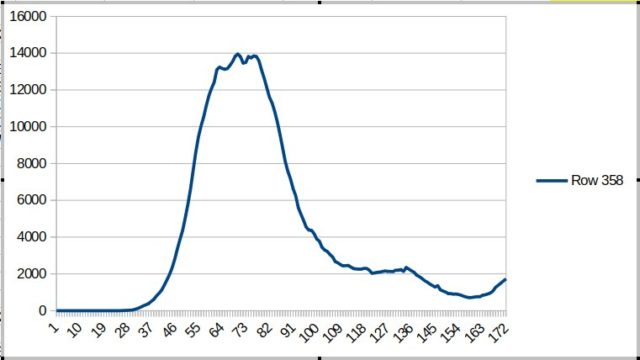
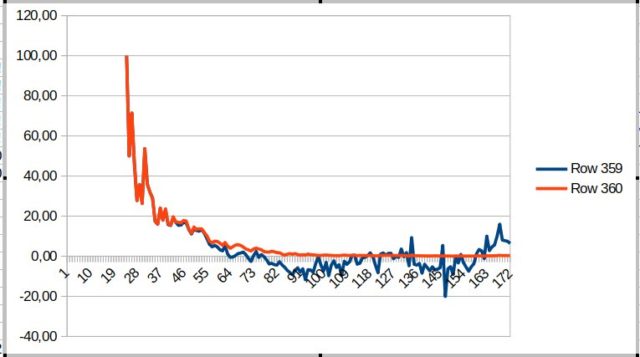
The blue line in the chart below stands for the reproduction number of the virus in the country. If above zero, numbers ar on the rise, if below zero they decline. Blue line of the chart below is an immediate sign for what is happening. They work out in the first chart within 1,5 to 2 weeks because of the incubation time.
State of the Pandemic (Spain, update)
Dagelijkse foto 2-07 (24 juli 2020)