COVID-19 case fatality rate per country

Case fatality rate is the percentage of people getting ill from COVID-19 that die in a certain country

Numbers are of 19 October 2020

Country Case fatality rate
1 Italy 8,8%
2 Ecuador 8,1%
3 Chad 6,9%
4 Bolivia 6,1%
5 Sudan 6,1%
6 United Kingdom 6,0%
7 Liberia 6,0%
8 Egypt 5,8%
9 Sweden 5,7%
10 Iran 5,7%
11 Niger 5,7%
12 San Marino 5,5%
13 China 5,2%
14 Canada 5,1%
15 Syria 4,8%
16 Belgium 4,7%
17 Ireland 4,1%
18 Tanzania 4,1%
19 Kosovo 4,0%
20 Peru 3,9%
21 Mali 3,9%
22 France 3,8%
23 Afghanistan 3,7%
24 Spain 3,6%
25 North Macedonia 3,5%
26 Guatemala 3,5%
27 Bulgaria 3,5%
28 Indonesia 3,5%
29 Romania 3,4%
30 Algeria 3,4%
31 Australia 3,3%
32 Barbados 3,3%

Click ‘Continue reading’ to see the complete list
Continue reading

COVID-19 deaths per per country per 100,000 inhabitants

Numbers are of 19 October 2020
Country Deaths per 100.000 population
1 San Marino 124,32
2 Peru 105,35
3 Belgium 91,17
4 Andorra 76,62
5 Bolivia 74,7
6 Brazil 73,36
7 Chile 72,8
8 Ecuador 72,5
9 Spain 72,29
10 Mexico 68,28
11 United States 67,14
12 United Kingdom 65,78
13 Panama 61,39
14 Italy 60,47
15 Argentina 59,03
16 Colombia 58,35
17 Sweden 58,12
18 France 49,75
19 Moldova 44,67
20 North Macedonia 40,04
21 Netherlands 39,53
22 Ireland 37,81
23 Iran 35,88
24 Kosovo 35,22
25 Armenia 35,2
26 Montenegro 34,87
27 South Africa 31,41
28 Bosnia and Herzegovina 28,82
29 Romania 28,76
30 Bahamas 28,26
31 Honduras 26,42
32 Canada 26,23

Click on ‘Continue reading’ to see the complete list
Continue reading

State of the Pandemic (Denmark update)

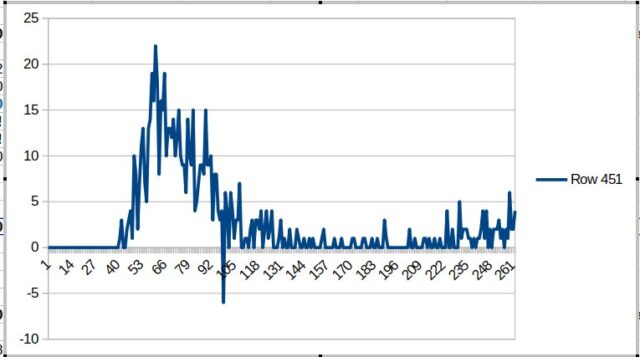
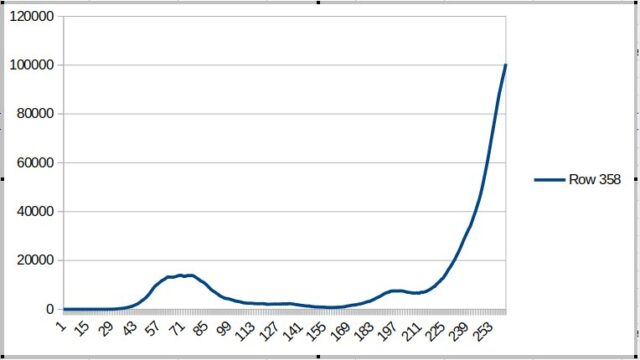
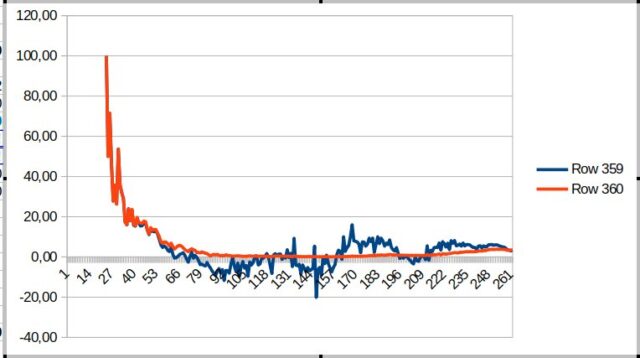
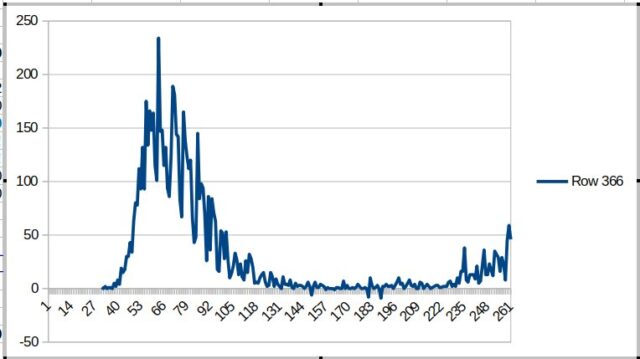
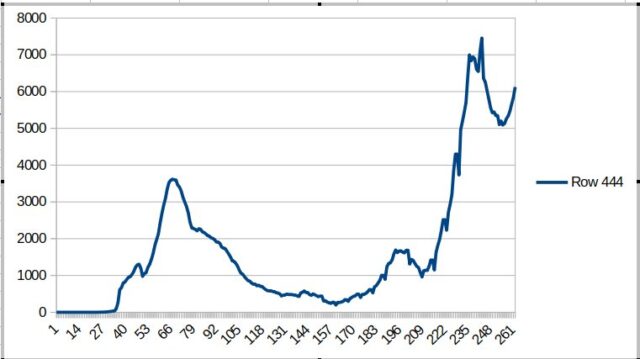
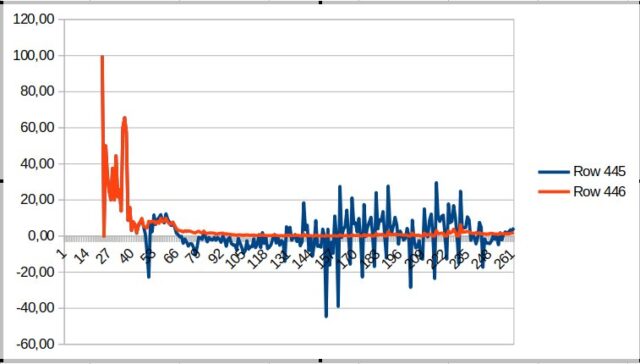
Charts are all for the Netherlands, from 5 Feb until 23 Oct 2020

Number of people (still) sick on a given day.

Reproduction number in % minus 1 on any given day (blue line).

Number of deaths on a given day.

Own statistics based upon numbers supplied by WHO

State of the Pandemic (Netherlands update)

Charts are all for the Netherlands, from 5 Feb until 23 Oct 2020

Number of people (still) sick on a given day. To the left of the graph you can see the maximum of last spring.

Reproduction number minus 1 on any given day (blue line).

Number of deaths on a given day.

Own statistics based upon numbers supplied by WHO