Charts are all for Netherlands, from 5 Feb 2020 until 8 Jul 2021
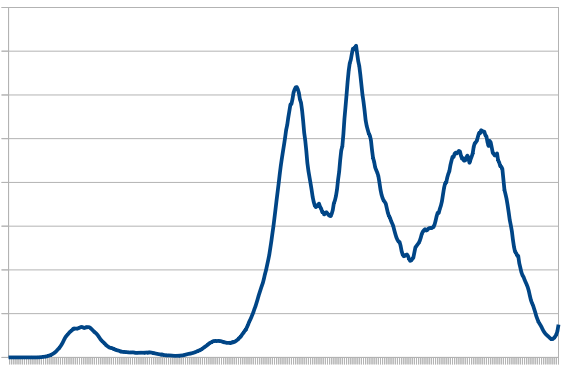
Number of people (still) sick on a given day
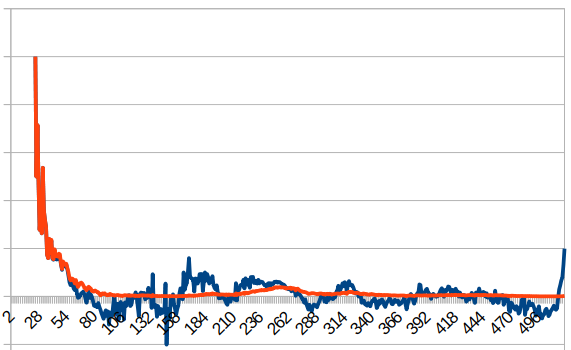
Reproduction number in % minus 1 on any given day (blue line).
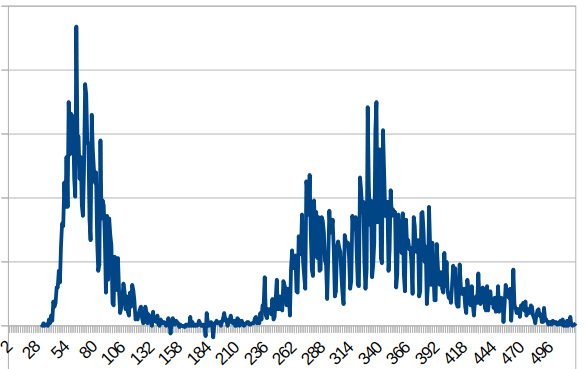
Number of deaths on a given day.
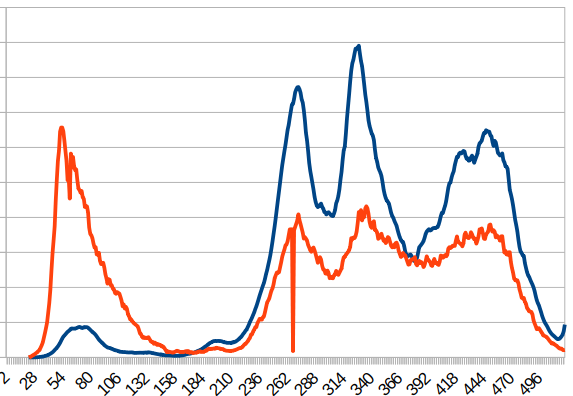
Number of people tested positive, vs. number of people in a hospital on a given day. (Numbers normalised in scale to be able to compare, blue is tested positive, and orange hospital beds occupied by covid patients).