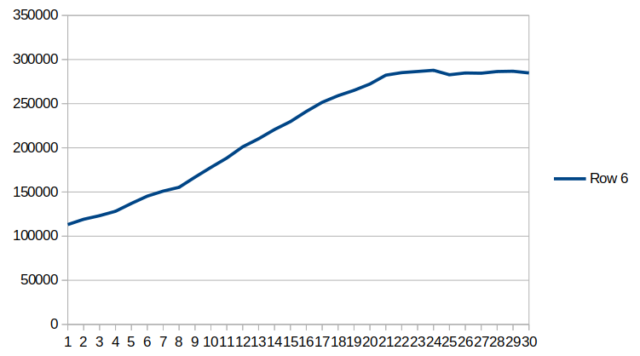
Charts below are for Netherlands, for the month before 17 Dec. 2021
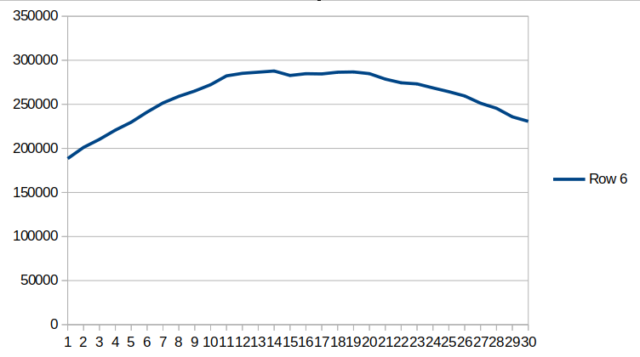
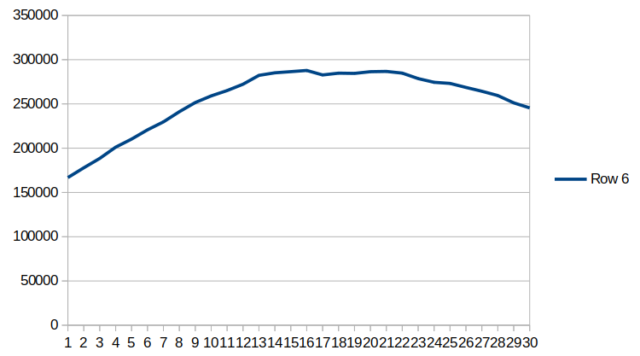
Above chart: Number of people (still) ill on a given day
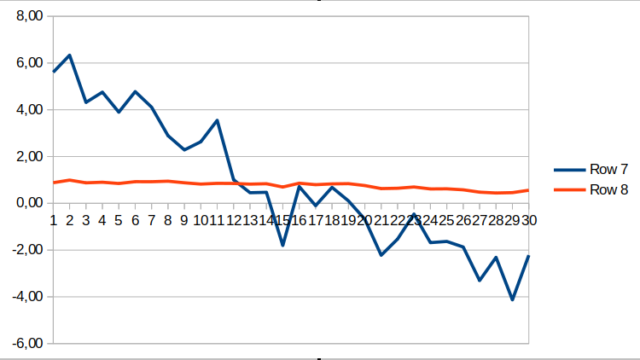
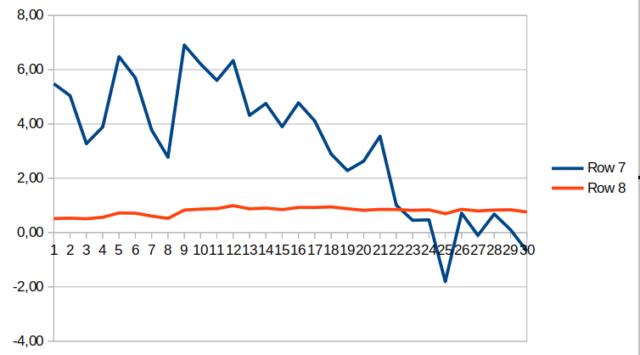
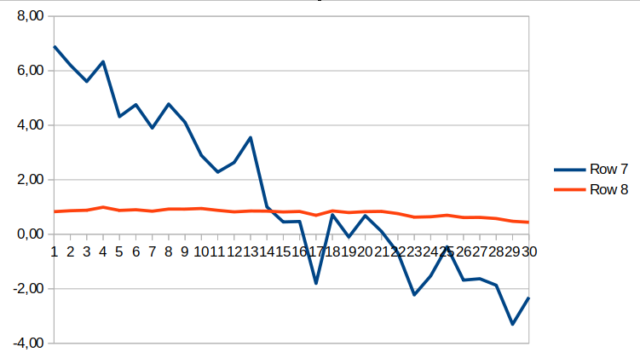
Above chart: Reproduction number in % minus 1 on any given day (blue line).
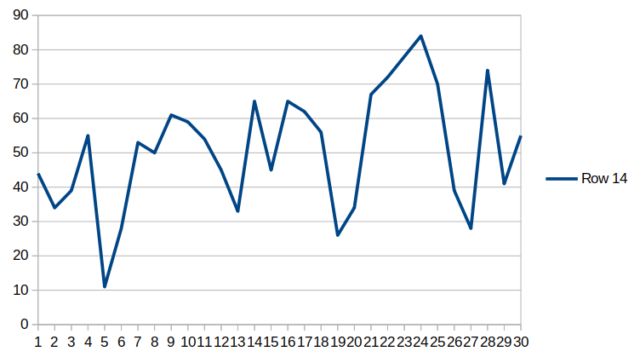
Above chart: Number of deaths on a given day.
Own statistics based upon numbers supplied by WHO
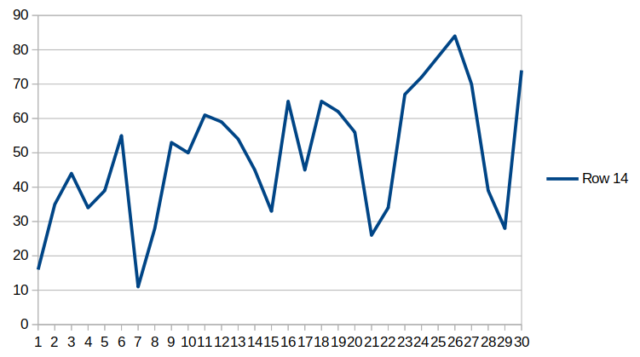 Above chart: Number of deaths on a given day.